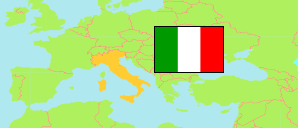
Matera
Province in Italy
Contents: Population
The population development of Matera as well as related information and services (Wikipedia, Google, images).
| Name | Status | Population Census 1981-10-25 | Population Census 1991-10-20 | Population Census 2001-10-21 | Population Census 2011-10-09 | Population Census 2021-12-31 | Population Estimate 2025-01-01 | |
|---|---|---|---|---|---|---|---|---|
| Matera | Province | 203,570 | 208,985 | 204,239 | 200,101 | 191,552 | 189,098 | |
| Italia [Italy] | Republic | 56,556,911 | 56,778,031 | 56,995,744 | 59,433,744 | 59,030,133 | 58,934,177 |
Source: Istituto Nazionale di Statistica Italia.
Explanation: The 2025 figures are preliminary.
Further information about the population structure:
| Gender (E 2025) | |
|---|---|
| Males | 93,945 |
| Females | 95,153 |
| Age Groups (E 2025) | |
|---|---|
| 0-17 years | 26,722 |
| 18-64 years | 114,459 |
| 65+ years | 47,917 |
| Age Distribution (E 2025) | |
|---|---|
| 90+ years | 2,793 |
| 80-89 years | 11,359 |
| 70-79 years | 20,873 |
| 60-69 years | 27,107 |
| 50-59 years | 29,017 |
| 40-49 years | 25,266 |
| 30-39 years | 21,516 |
| 20-29 years | 20,661 |
| 10-19 years | 17,213 |
| 0-9 years | 13,293 |
| Citizenship (E 2025) | |
|---|---|
| Italy | 175,238 |
| Foreign Citizenship | 13,860 |
