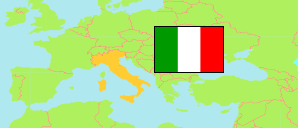
Potenza
Province in Italy
Contents: Population
The population development of Potenza as well as related information and services (Wikipedia, Google, images).
| Name | Status | Population Census 1981-10-25 | Population Census 1991-10-20 | Population Census 2001-10-21 | Population Census 2011-10-09 | Population Census 2021-12-31 | Population Estimate 2025-01-01 | |
|---|---|---|---|---|---|---|---|---|
| Potenza | Province | 406,616 | 401,543 | 393,529 | 377,935 | 349,616 | 340,799 | |
| Italia [Italy] | Republic | 56,556,911 | 56,778,031 | 56,995,744 | 59,433,744 | 59,030,133 | 58,934,177 |
Source: Istituto Nazionale di Statistica Italia.
Explanation: The 2025 figures are preliminary.
Further information about the population structure:
| Gender (E 2025) | |
|---|---|
| Males | 168,659 |
| Females | 172,140 |
| Age Groups (E 2025) | |
|---|---|
| 0-17 years | 45,328 |
| 18-64 years | 205,986 |
| 65+ years | 89,485 |
| Age Distribution (E 2025) | |
|---|---|
| 90+ years | 6,010 |
| 80-89 years | 20,926 |
| 70-79 years | 38,360 |
| 60-69 years | 52,455 |
| 50-59 years | 54,755 |
| 40-49 years | 43,257 |
| 30-39 years | 37,981 |
| 20-29 years | 35,276 |
| 10-19 years | 29,303 |
| 0-9 years | 22,476 |
| Citizenship (E 2025) | |
|---|---|
| Italy | 327,300 |
| Foreign Citizenship | 13,499 |
