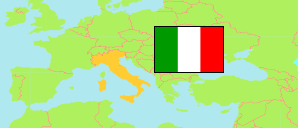
Sicilia
Autonomous Region in Italy
Contents: Subdivision
The population development in Sicilia as well as related information and services (Wikipedia, Google, images).
| Name | Status | Population Census 1981-10-25 | Population Census 1991-10-20 | Population Census 2001-10-21 | Population Census 2011-10-09 | Population Census 2021-12-31 | Population Estimate 2025-01-01 | |
|---|---|---|---|---|---|---|---|---|
| Sicilia [Sicily] | Autonomous Region | 4,906,878 | 4,966,386 | 4,968,991 | 5,002,904 | 4,833,329 | 4,779,371 | |
| Agrigento | Province | 466,495 | 476,158 | 448,053 | 446,837 | 415,887 | 408,059 | → |
| Caltanissetta | Province | 285,829 | 278,275 | 274,035 | 273,099 | 251,715 | 244,913 | → |
| Catania | Province | 1,005,577 | 1,035,665 | 1,054,778 | 1,078,766 | 1,077,515 | 1,068,563 | → |
| Enna | Province | 190,939 | 186,182 | 177,200 | 173,451 | 156,730 | 152,387 | → |
| Messina | Metropolitan City | 669,323 | 646,871 | 662,450 | 649,824 | 603,229 | 595,948 | → |
| Palermo | Metropolitan City | 1,198,575 | 1,224,778 | 1,235,923 | 1,243,585 | 1,208,991 | 1,194,439 | → |
| Ragusa | Province | 274,583 | 289,733 | 295,264 | 307,492 | 316,142 | 320,976 | → |
| Siracusa [Syracuse] | Province | 394,692 | 402,014 | 396,167 | 399,933 | 385,900 | 382,690 | → |
| Trapani | Province | 420,865 | 426,710 | 425,121 | 429,917 | 417,220 | 411,396 | → |
| Italia [Italy] | Republic | 56,556,911 | 56,778,031 | 56,995,744 | 59,433,744 | 59,030,133 | 58,934,177 |
Source: Istituto Nazionale di Statistica Italia.
Explanation: The 2025 figures are preliminary.
Further information about the population structure:
| Gender (E 2025) | |
|---|---|
| Males | 2,333,921 |
| Females | 2,445,450 |
| Age Groups (E 2025) | |
|---|---|
| 0-17 years | 760,856 |
| 18-64 years | 2,886,805 |
| 65+ years | 1,131,710 |
| Age Distribution (E 2025) | |
|---|---|
| 90+ years | 59,645 |
| 80-89 years | 261,205 |
| 70-79 years | 503,038 |
| 60-69 years | 660,692 |
| 50-59 years | 733,816 |
| 40-49 years | 630,777 |
| 30-39 years | 551,863 |
| 20-29 years | 515,173 |
| 10-19 years | 475,251 |
| 0-9 years | 387,911 |
| Citizenship (E 2025) | |
|---|---|
| Italy | 4,570,224 |
| Foreign Citizenship | 209,147 |