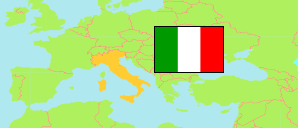
Emilia-Romagna
Region in Italy
Contents: Subdivision
The population development in Emilia-Romagna as well as related information and services (Wikipedia, Google, images).
| Name | Status | Population Census 1981-10-25 | Population Census 1991-10-20 | Population Census 2001-10-21 | Population Census 2011-10-09 | Population Census 2021-12-31 | Population Estimate 2025-01-01 | |
|---|---|---|---|---|---|---|---|---|
| Emilia-Romagna | Region | 3,977,104 | 3,928,841 | 4,003,196 | 4,344,755 | 4,425,366 | 4,465,678 | |
| Bologna | Metropolitan City | 930,284 | 906,856 | 915,225 | 976,243 | 1,010,812 | 1,020,865 | → |
| Ferrara | Province | 381,118 | 360,763 | 344,323 | 353,481 | 339,573 | 339,999 | → |
| Forlì-Cesena | Province | 349,092 | 348,647 | 358,542 | 390,738 | 391,293 | 393,628 | → |
| Modena | Province | 596,025 | 604,680 | 633,993 | 685,777 | 701,751 | 709,149 | → |
| Parma | Province | 400,192 | 391,330 | 392,976 | 427,434 | 448,916 | 456,015 | → |
| Piacenza | Province | 278,424 | 267,633 | 263,872 | 284,616 | 283,435 | 286,743 | → |
| Ravenna | Province | 358,654 | 350,454 | 347,847 | 384,761 | 385,631 | 387,501 | → |
| Reggio nell'Emilia | Province | 413,396 | 420,431 | 453,892 | 517,316 | 525,586 | 531,113 | → |
| Rimini | Province | 269,919 | 278,047 | 292,526 | 324,389 | 338,369 | 340,665 | → |
| Italia [Italy] | Republic | 56,556,911 | 56,778,031 | 56,995,744 | 59,433,744 | 59,030,133 | 58,934,177 |
Source: Istituto Nazionale di Statistica Italia.
Explanation: The 2025 figures are preliminary.
Further information about the population structure:
| Gender (E 2025) | |
|---|---|
| Males | 2,194,241 |
| Females | 2,271,437 |
| Age Groups (E 2025) | |
|---|---|
| 0-17 years | 657,433 |
| 18-64 years | 2,695,709 |
| 65+ years | 1,112,536 |
| Age Distribution (E 2025) | |
|---|---|
| 90+ years | 75,244 |
| 80-89 years | 297,059 |
| 70-79 years | 462,921 |
| 60-69 years | 607,188 |
| 50-59 years | 734,874 |
| 40-49 years | 599,689 |
| 30-39 years | 499,062 |
| 20-29 years | 446,275 |
| 10-19 years | 417,984 |
| 0-9 years | 325,382 |
| Citizenship (E 2025) | |
|---|---|
| Italy | 3,895,732 |
| Foreign Citizenship | 569,946 |