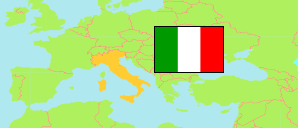
Liguria
Region in Italy
Contents: Subdivision
The population development in Liguria as well as related information and services (Wikipedia, Google, images).
| Name | Status | Population Census 1981-10-25 | Population Census 1991-10-20 | Population Census 2001-10-21 | Population Census 2011-10-09 | Population Evaluation 2022-01-01 | Population Evaluation 2024-01-01 | |
|---|---|---|---|---|---|---|---|---|
| Liguria | Region | 1,807,893 | 1,676,282 | 1,571,783 | 1,570,694 | 1,509,227 | 1,508,847 | |
| Genova [Genoa] | Metropolitan City | 1,045,109 | 950,849 | 878,082 | 855,834 | 817,402 | 817,260 | → |
| Imperia | Province | 223,738 | 213,587 | 205,238 | 214,502 | 208,670 | 208,844 | → |
| La Spezia | Province | 241,371 | 227,199 | 215,935 | 219,330 | 215,117 | 215,159 | → |
| Savona | Province | 297,675 | 284,647 | 272,528 | 281,028 | 268,038 | 267,584 | → |
| Italia [Italy] | Republic | 56,556,911 | 56,778,031 | 56,995,744 | 59,433,744 | 59,030,133 | 58,989,749 |
Source: Istituto Nazionale di Statistica Italia.
Explanation: Population figures for 2022 and later are result of a sampling survey combined with an evaluation of registers. The 2024 figures are preliminary.
Further information about the population structure:
| Gender (R 2024) | |
|---|---|
| Males | 728,673 |
| Females | 780,174 |
| Age Groups (R 2024) | |
|---|---|
| 0-17 years | 197,475 |
| 18-64 years | 874,314 |
| 65+ years | 437,058 |
| Age Distribution (R 2024) | |
|---|---|
| 90+ years | 31,490 |
| 80-89 years | 124,396 |
| 70-79 years | 179,801 |
| 60-69 years | 219,255 |
| 50-59 years | 254,261 |
| 40-49 years | 183,280 |
| 30-39 years | 151,238 |
| 20-29 years | 140,933 |
| 10-19 years | 127,226 |
| 0-9 years | 96,967 |
| Citizenship (R 2024) | |
|---|---|
| Italy | 1,352,706 |
| Foreign Citizenship | 156,141 |