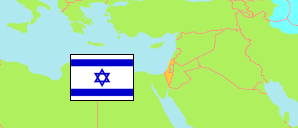
Hadera
in Hadera (Haifa District)
Contents: Urban Locality (jewish)
The population development of Hadera as well as related information and services (weather, Wikipedia, Google, images).
| Name | Native | Subdistrict | Population Census 1983-06-04 | Population Census 1995-11-04 | Population Census 2008-12-27 | Population Estimate 2013-12-31 | Population Estimate 2021-12-31 | |
|---|---|---|---|---|---|---|---|---|
| Hadera | חדרה | Hadera | 38,711 | 60,445 | 79,400 | 85,397 | 100,631 | → |
Source: Central Bureau of Statistics, The State of Israel.
Further information about the population structure:
| Gender (E 2021) | |
|---|---|
| Males | 49,300 |
| Females | 51,331 |
| Age Groups (E 2021) | |
|---|---|
| 0-14 years | 23,882 |
| 15-64 years | 60,496 |
| 65+ years | 16,252 |
| Age Distribution (E 2021) | |
|---|---|
| 80+ years | 3,871 |
| 70-79 years | 7,216 |
| 60-69 years | 10,362 |
| 50-59 years | 10,487 |
| 40-49 years | 12,592 |
| 30-39 years | 13,524 |
| 20-29 years | 12,289 |
| 10-19 years | 13,694 |
| 0-9 years | 16,595 |
| Ethnic Group (E 2021) | |
|---|---|
| Jews | 92,046 |
| Arabs | 942 |
| Other ethnic group | 7,643 |