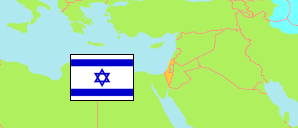
Qiryat Atta
Urban Locality (jewish) in Haifa Metropolitan Area
Contents: Subdivision
The population development in Qiryat Atta as well as related information and services (Wikipedia, Google, images).
| Name | Status | Native | Population Estimate 2013-12-31 | Population Estimate 2017-12-31 | Population Estimate 2021-12-31 | |
|---|---|---|---|---|---|---|
| Qiryat Atta [Kiryat Ata] | Urban Locality (jewish) | קריית אתא | 53,378 | 57,518 | 60,102 | |
| Qiryat Atta 0011 | Residential Area (jewish) | קריית אתא 0011 | 6,290 | 6,581 | 6,479 | → |
| Qiryat Atta 0012 | Residential Area (jewish) | קריית אתא 0012 | 3,730 | 4,336 | 5,604 | → |
| Qiryat Atta 0013 | Residential Area (jewish) | קריית אתא 0013 | 4,400 | 4,189 | 4,009 | → |
| Qiryat Atta 0014 | Residential Area (jewish) | קריית אתא 0014 | 4,430 | 4,154 | 3,823 | → |
| Qiryat Atta 0021 | Residential Area (jewish) | קריית אתא 0021 | 5,970 | 6,350 | 6,567 | → |
| Qiryat Atta 0022 | Residential Area (jewish) | קריית אתא 0022 | 4,740 | 5,088 | 5,592 | → |
| Qiryat Atta 0023 | Residential Area (jewish) | קריית אתא 0023 | 4,590 | 5,048 | 5,054 | → |
| Qiryat Atta 0024 | Residential Area (jewish) | קריית אתא 0024 | 5,200 | 5,856 | 6,205 | → |
| Qiryat Atta 0025 | Residential Area (jewish) | קריית אתא 0025 | 6,930 | 8,007 | 8,918 | → |
| Qiryat Atta 0031 | Residential Area (jewish) | קריית אתא 0031 | 3,770 | 4,407 | 4,358 | → |
| Qiryat Atta 0032 | Residential Area (jewish) | קריית אתא 0032 | 3,340 | 3,499 | 3,494 | → |
| Qiryat Atta 0033 | Industrial Area | קריית אתא 0033 | ... | ... | ... | → |
| Hefa [Haifa] | Metropolitan Area | חיפה | 583,210 | 610,028 | 637,956 |
Source: Central Bureau of Statistics, The State of Israel.
Further information about the population structure:
| Gender (E 2021) | |
|---|---|
| Males | 29,416 |
| Females | 30,686 |
| Age Groups (E 2021) | |
|---|---|
| 0-14 years | 13,638 |
| 15-64 years | 36,153 |
| 65+ years | 10,313 |
| Age Distribution (E 2021) | |
|---|---|
| 80+ years | 2,217 |
| 70-79 years | 4,845 |
| 60-69 years | 6,553 |
| 50-59 years | 6,408 |
| 40-49 years | 7,207 |
| 30-39 years | 7,919 |
| 20-29 years | 7,624 |
| 10-19 years | 7,805 |
| 0-9 years | 9,526 |
| Ethnic Group (E 2021) | |
|---|---|
| Jews & Others | 59,967 |
| Arabs | 135 |