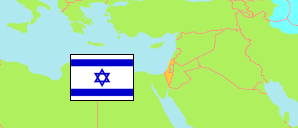
Nesher
Urban Locality (jewish) in Haifa Metropolitan Area
Contents: Subdivision
The population development in Nesher as well as related information and services (Wikipedia, Google, images).
| Name | Status | Native | Population Estimate 2013-12-31 | Population Estimate 2017-12-31 | Population Estimate 2021-12-31 | |
|---|---|---|---|---|---|---|
| Nesher | Urban Locality (jewish) | נשר | 23,319 | 23,749 | 23,760 | |
| Nesher 0001 | Industrial Area | נשר 0001 | ... | 14 | 218 | → |
| Nesher 0002 | Residential Area (jewish) | נשר 0002 | 3,040 | 3,063 | 3,461 | → |
| Nesher 0003 | Residential Area (jewish) | נשר 0003 | 2,990 | 2,799 | 2,432 | → |
| Nesher 0004 | Residential Area (jewish) | נשר 0004 | 3,120 | 3,657 | 3,703 | → |
| Nesher 0005 | Residential Area (jewish) | נשר 0005 | 3,680 | 3,698 | 3,528 | → |
| Nesher 0006 | Residential Area (jewish) | נשר 0006 | 3,530 | 3,450 | 3,314 | → |
| Nesher 0007 | Residential Area (jewish) | נשר 0007 | 6,950 | 7,068 | 7,103 | → |
| Hefa [Haifa] | Metropolitan Area | חיפה | 583,210 | 610,028 | 637,956 |
Source: Central Bureau of Statistics, The State of Israel.
Further information about the population structure:
| Gender (E 2021) | |
|---|---|
| Males | 11,537 |
| Females | 12,223 |
| Age Groups (E 2021) | |
|---|---|
| 0-14 years | 4,365 |
| 15-64 years | 14,769 |
| 65+ years | 4,627 |
| Age Distribution (E 2021) | |
|---|---|
| 80+ years | 1,151 |
| 70-79 years | 2,045 |
| 60-69 years | 2,911 |
| 50-59 years | 2,673 |
| 40-49 years | 2,982 |
| 30-39 years | 3,171 |
| 20-29 years | 3,127 |
| 10-19 years | 2,732 |
| 0-9 years | 2,969 |
| Ethnic Group (E 2021) | |
|---|---|
| Jews & Others | 23,425 |
| Arabs | 334 |