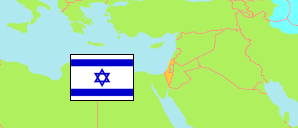
Misgav
Regional Council Area in Israel
Contents: Population
The population development of Misgav as well as related information and services (Wikipedia, Google, images).
| Name | Status | Native | Population Census 1983-06-04 | Population Census 1995-11-04 | Population Census 2008-12-27 | Population Estimate 2013-12-31 | Population Estimate 2021-12-31 | |
|---|---|---|---|---|---|---|---|---|
| Misgav | Regional Council Area | משגב | 1,900 | 12,100 | 20,600 | 25,300 | 30,192 | |
| Jisra'el [Israel] | State | ישראל | 4,037,400 | 5,643,500 | 7,412,200 | 8,134,500 | 9,452,975 |
Source: Central Bureau of Statistics, The State of Israel.
Explanation: The population structure information does not consider people living outside of localities.
Further information about the population structure:
| Gender (E 2021) | |
|---|---|
| Males | 15,234 |
| Females | 14,958 |
| Age Groups (E 2021) | |
|---|---|
| 0-14 years | 8,561 |
| 15-64 years | 19,422 |
| 65+ years | 2,209 |
| Age Distribution (E 2021) | |
|---|---|
| 80+ years | 216 |
| 70-79 years | 965 |
| 60-69 years | 2,303 |
| 50-59 years | 3,475 |
| 40-49 years | 4,152 |
| 30-39 years | 3,090 |
| 20-29 years | 4,526 |
| 10-19 years | 5,997 |
| 0-9 years | 5,349 |
| Ethnic Group (E 2021) | |
|---|---|
| Jews | 21,743 |
| Arabs | 7,824 |
| Other ethnic group | 486 |
Comprises:
- Arab Al Naim settlement
- Atsmon Segev settlement
- Avtalyon settlement
- Demeide settlement
- Eshbal settlement
- Eshhar settlement
- Gilon settlement
- Haluz settlement
- Hararit settlement
- Harashim settlement
- Hussniyya settlement
- Kamane settlement
- Kammon settlement
- Kishor settlement
- Lavon settlement
- Lotem settlement
- Manof settlement
- Mikhmannim settlement
- Mizpe Aviv settlement
- Moran settlement
- Moreshet settlement
- Pelekh settlement
- Qoranit settlement
- Raqqefet settlement
- Ras al-Ein settlement
- Sallama settlement
- Shekhanya settlement
- Shorashim settlement
- Tal-El settlement
- Tuval settlement
- Ya'ad settlement
- Yodefat settlement
- Yuvallim settlement
- Zurit settlement
- Zviyya settlement