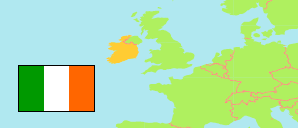
Monaghan
County in Ireland
Contents: Population
The population development of Monaghan as well as related information and services (Wikipedia, Google, images).
| Name | Status | Population Census 1981-04-05 | Population Census 1986-04-13 | Population Census 1991-04-21 | Population Census 1996-04-28 | Population Census 2002-04-28 | Population Census 2006-04-23 | Population Census 2011-04-10 | Population Census 2016-04-24 | Population Census 2022-04-03 | |
|---|---|---|---|---|---|---|---|---|---|---|---|
| Monaghan | County | 51,192 | 52,379 | 51,293 | 51,313 | 52,593 | 55,997 | 60,483 | 61,386 | 65,288 | |
| Ireland (Éire) | Republic | 3,443,405 | 3,540,643 | 3,525,719 | 3,626,087 | 3,917,203 | 4,239,848 | 4,588,252 | 4,761,865 | 5,149,139 |
Source: Central Statistics Office, Ireland.
Further information about the population structure:
| Gender (C 2022) | |
|---|---|
| Males | 32,894 |
| Females | 32,394 |
| Age Groups (C 2022) | |
|---|---|
| 0-17 years | 17,178 |
| 18-64 years | 37,713 |
| 65+ years | 10,397 |
| Age Distribution (C 2022) | |
|---|---|
| 90+ years | 371 |
| 80-89 years | 1,981 |
| 70-79 years | 4,820 |
| 60-69 years | 6,879 |
| 50-59 years | 8,093 |
| 40-49 years | 9,615 |
| 30-39 years | 8,390 |
| 20-29 years | 6,428 |
| 10-19 years | 9,553 |
| 0-9 years | 9,158 |
| Country of Birth (C 2022) | |
|---|---|
| Ireland | 50,163 |
| Other country | 15,125 |
| Religion (C 2022) | |
|---|---|
| Catholic | 50,972 |
| Other Religion | 7,299 |
| No Religion | 4,426 |
