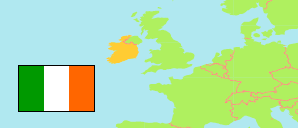
Cavan
County in Ireland
Contents: Population
The population development of Cavan as well as related information and services (Wikipedia, Google, images).
| Name | Status | Population Census 1981-04-05 | Population Census 1986-04-13 | Population Census 1991-04-21 | Population Census 1996-04-28 | Population Census 2002-04-28 | Population Census 2006-04-23 | Population Census 2011-04-10 | Population Census 2016-04-24 | Population Census 2022-04-03 | |
|---|---|---|---|---|---|---|---|---|---|---|---|
| Cavan | County | 53,855 | 53,965 | 52,796 | 52,944 | 56,546 | 64,003 | 73,183 | 76,176 | 81,704 | |
| Ireland (Éire) | Republic | 3,443,405 | 3,540,643 | 3,525,719 | 3,626,087 | 3,917,203 | 4,239,848 | 4,588,252 | 4,761,865 | 5,149,139 |
Source: Central Statistics Office, Ireland.
Further information about the population structure:
| Gender (C 2022) | |
|---|---|
| Males | 41,060 |
| Females | 40,644 |
| Age Groups (C 2022) | |
|---|---|
| 0-17 years | 21,370 |
| 18-64 years | 47,833 |
| 65+ years | 12,501 |
| Age Distribution (C 2022) | |
|---|---|
| 90+ years | 440 |
| 80-89 years | 2,431 |
| 70-79 years | 5,671 |
| 60-69 years | 8,416 |
| 50-59 years | 10,525 |
| 40-49 years | 12,023 |
| 30-39 years | 10,663 |
| 20-29 years | 8,143 |
| 10-19 years | 12,202 |
| 0-9 years | 11,190 |
| Country of Birth (C 2022) | |
|---|---|
| Ireland | 65,614 |
| Other country | 16,090 |
| Religion (C 2022) | |
|---|---|
| Catholics | 60,785 |
| Other Religion | 9,517 |
| No Religion | 6,898 |