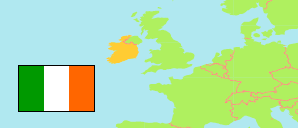
Meath
County in Ireland
Contents: Population
The population development of Meath as well as related information and services (Wikipedia, Google, images).
| Name | Status | Population Census 1981-04-05 | Population Census 1986-04-13 | Population Census 1991-04-21 | Population Census 1996-04-28 | Population Census 2002-04-28 | Population Census 2006-04-23 | Population Census 2011-04-10 | Population Census 2016-04-24 | Population Census 2022-04-03 | |
|---|---|---|---|---|---|---|---|---|---|---|---|
| Meath | County | 95,419 | 103,881 | 105,370 | 109,732 | 134,005 | 162,831 | 184,135 | 195,044 | 220,826 | |
| Ireland (Éire) | Republic | 3,443,405 | 3,540,643 | 3,525,719 | 3,626,087 | 3,917,203 | 4,239,848 | 4,588,252 | 4,761,865 | 5,149,139 |
Source: Central Statistics Office, Ireland.
Further information about the population structure:
| Gender (C 2022) | |
|---|---|
| Males | 109,988 |
| Females | 110,838 |
| Age Groups (C 2022) | |
|---|---|
| 0-17 years | 60,202 |
| 18-64 years | 133,565 |
| 65+ years | 27,059 |
| Age Distribution (C 2022) | |
|---|---|
| 90+ years | 816 |
| 80-89 years | 4,845 |
| 70-79 years | 12,666 |
| 60-69 years | 19,096 |
| 50-59 years | 28,232 |
| 40-49 years | 36,376 |
| 30-39 years | 29,982 |
| 20-29 years | 22,630 |
| 10-19 years | 34,960 |
| 0-9 years | 31,223 |
| Country of Birth (C 2022) | |
|---|---|
| Ireland | 179,443 |
| Other country | 41,383 |
| Religion (C 2022) | |
|---|---|
| Catholics | 160,036 |
| Other Religion | 21,990 |
| No Religion | 29,198 |