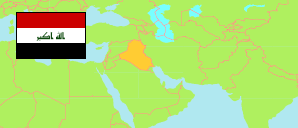
Al-Muthannā
Governorate in Iraq
Contents: Subdivision
The population development in Al-Muthannā as well as related information and services (Wikipedia, Google, images).
| Name | Status | Native | Population Estimate 2009-10-17 | Population Estimate 2018-07-01 | |
|---|---|---|---|---|---|
| Al-Muthannā | Governorate | المثنى | 683,126 | 814,371 | |
| Ad-Darājī | Subdistrict | الدراجي | 16,661 | 19,409 | → |
| Al-Buṣaiyah | Subdistrict | البصیة | 935 | 1,153 | → |
| Al-Hilāl | Subdistrict | الھلال | 34,770 | 40,426 | → |
| Al-Karāmah | Subdistrict | الکرامة | 28,635 | 33,202 | → |
| Al-Khiḍir | Central Subdistrict | الخضر | 77,476 | 92,418 | → |
| Al-Majd | Subdistrict | المجد | 37,952 | 44,111 | → |
| Al-Warkā' | Central Subdistrict | الوركاء | 57,485 | 66,654 | → |
| An-Najmī | Subdistrict | النجمي | 30,884 | 35,781 | → |
| Ar-Rumaītah | Central Subdistrict | الرمیتة | 101,229 | 122,729 | → |
| As-Salmān | Central Subdistrict | السلمان | 8,389 | 9,917 | → |
| As-Samāwah [Samawah] | Central Subdistrict | السماوة | 247,197 | 300,458 | → |
| As-Suwaīr | Subdistrict | السویر | 41,513 | 48,113 | → |
| Al-'Irāq [Iraq] | Republic | 31,664,466 | 38,124,182 |
Source: Central Organization for Statistics and Information Technology (web).
Explanation: Area figures of subdistricts are computed by using geospatial data.