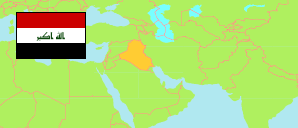
Baghdād
Governorate in Iraq
Contents: Subdivision
The population development in Baghdād as well as related information and services (Wikipedia, Google, images).
| Name | Status | Native | Population Estimate 2009-10-17 | Population Estimate 2018-07-01 | |
|---|---|---|---|---|---|
| Baghdād | Governorate | بغداد | 6,702,538 | 8,126,755 | |
| Abū Ghraīb | District | أبو غريب | 269,171 | 323,068 | → |
| Al-Ā'ẓamiyah [Adhamiyah] | District | الاعظمیة | 989,000 | 1,202,492 | → |
| Al-Karkh | District | الكرخ | 1,309,488 | 1,593,676 | → |
| Al-Kāẓimiyyah [Kadhimiya] | District | الكاظمیة | 740,684 | 897,396 | → |
| Al-Madā'in | District | المدائن | 383,868 | 459,673 | → |
| Al-Maḥmūdiyah [Mahmoudiyah] | District | المحمودیة | 405,838 | 484,004 | → |
| Ar-Ruṣāfah | District | الرصافة | 1,486,799 | 1,809,468 | → |
| Aṣ-Ṣadr al-Āwlā [Sadr City 1] | District | الصدر الاولى | 582,067 | 708,388 | → |
| Aṣ-Ṣadr ath-Thāniyah [Sadr City 2] | District | الصدر الثانیة | 413,683 | 503,461 | → |
| Aṭ-Ṭārmiyah | District | الطارمية | 121,940 | 145,129 | → |
| Al-'Irāq [Iraq] | Republic | 31,664,466 | 38,124,182 |
Source: Central Organization for Statistics and Information Technology (web).
Explanation: Area figures of districts are computed by using geospatial data.
