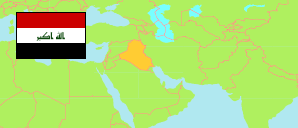
Nīnawā
Governorate in Iraq
Contents: Subdivision
The population development in Nīnawā as well as related information and services (Wikipedia, Google, images).
| Name | Status | Native | Population Estimate 2009-10-17 | Population Estimate 2018-07-01 | |
|---|---|---|---|---|---|
| Nīnawā [Nineveh] | Governorate | نينوى | 3,106,948 | 3,729,998 | |
| Al-Ba'āj | District | البعاج | 149,420 | 179,520 | → |
| Al-Ḥaḍra [Hatra] | District | الحضر | 49,420 | 59,429 | → |
| Al-Ḥamdāniyah | District | الحمدانية | 175,145 | 210,601 | → |
| Al-Mawṣil [Mosul] | District | الموصل | 1,588,427 | 1,905,174 | → |
| Ash-Shīkhān [Shekhan] | District | الشیخان | 36,598 | 43,984 | → |
| Makhmūr | District | مخمور | 174,101 | 209,545 | → |
| Sinjār | District | سنجار | 271,457 | 325,816 | → |
| Sumaīl | District | سمیل | 62,309 | 74,662 | → |
| Tal'afar [Tel Afar] | District | تلعفر | 425,214 | 511,004 | → |
| Talkayf [Tel Keppe, Tel Kaif] | District | تلكیف | 174,857 | 210,263 | → |
| Al-'Irāq [Iraq] | Republic | 31,664,466 | 38,124,182 |
Source: Central Organization for Statistics and Information Technology (web).
Explanation: Area figures of districts are computed by using geospatial data.