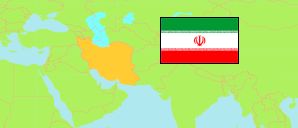
Chābahār
County in Iran
Contents: Population
The population development of Chābahār as well as related information and services (Wikipedia, Google, images).
| Name | Status | Native | Population Census 2011-10-24 | Population Census 2016-09-24 | |
|---|---|---|---|---|---|
| Chābahār | County | شهرستان چابهار | 264,051 | 283,204 | |
| Iran | Islamic Republic | ایران | 75,149,669 | 79,926,270 |
Source: Statistical Centre of Iran (web).
Explanation: Area figures of counties are derived from geospatial data.
Further information about the population structure:
| Gender (C 2016) | |
|---|---|
| Males | 144,482 |
| Females | 138,722 |
| Age Groups (C 2016) | |
|---|---|
| 0-14 years | 111,046 |
| 15-64 years | 164,980 |
| 65+ years | 7,178 |
| Age Distribution (C 2016) | |
|---|---|
| 90+ years | 522 |
| 80-89 years | 1,506 |
| 70-79 years | 2,697 |
| 60-69 years | 6,306 |
| 50-59 years | 10,542 |
| 40-49 years | 21,712 |
| 30-39 years | 47,234 |
| 20-29 years | 53,222 |
| 10-19 years | 58,666 |
| 0-9 years | 80,797 |
| Urbanization (C 2016) | |
|---|---|
| Rural | 170,778 |
| Urban | 112,409 |
| Literacy (A6+) (C 2016) | |
|---|---|
| yes | 156,255 |
| no | 74,927 |