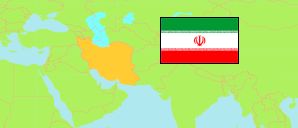
Khorāsān-e Razavi
Province in Iran
Contents: Subdivision
The population development in Khorāsān-e Razavi as well as related information and services (Wikipedia, Google, images).
| Name | Status | Native | Population Census 2011-10-24 | Population Census 2016-09-24 | |
|---|---|---|---|---|---|
| Khorāsān-e Razavi [Razavi Khorasan] | Province | خراسان رضوی | 5,994,402 | 6,434,501 | |
| Bajestān | County | شهرستان بجستان | 30,664 | 31,207 | → |
| Bākharz | County | شهرستان باخرز | 53,582 | 54,615 | → |
| Bardaskan | County | شهرستان بردسکن | 72,626 | 75,631 | → |
| Bīnālūd [Torqabeh and Shandiz] | County | شهرستان بینالود | 58,483 | 69,640 | → |
| Chenārān | County | شهرستان چناران | 125,601 | 155,013 | → |
| Dargaz | County | شهرستان درگز | 74,326 | 72,355 | → |
| Dāvarzan [← Sabzevār] | County | شهرستان داورزن | 21,309 | 21,911 | → |
| Farīmān | County | شهرستان فریمان | 93,930 | 99,001 | → |
| Fīrūzeh | County | شهرستان فیروزه | 42,739 | 37,539 | → |
| Gonābād | County | شهرستان گناباد | 80,783 | 88,753 | → |
| Joghatāī | County | شهرستان جغتای | 47,920 | 49,175 | → |
| Jowayin | County | شهرستان جوین | 54,139 | 54,488 | → |
| Kalāt | County | شهرستان کلات | 38,232 | 36,237 | → |
| Kāshmar | County | شهرستان کاشمر | 157,149 | 168,664 | → |
| Khalīl Ābād | County | شهرستان خلیل آباد | 49,111 | 51,701 | → |
| Khūshāb [Khoshab] | County | شهرستان خوشاب | 37,914 | 37,181 | → |
| Khvāf | County | شهرستان خواف | 121,859 | 138,972 | → |
| Mah va Lāt [Mahvelat] | County | شهرستان مه ولات | 48,900 | 51,409 | → |
| Mashhad | County | شهرستان مشهد | 3,069,941 | 3,372,660 | → |
| Nīshābūr [Nishapur] | County | شهرستان نیشابور | 433,105 | 451,780 | → |
| Qūchān | County | شهرستان قوچان | 179,714 | 174,495 | → |
| Roshtkvhār | County | شهرستان رشتخوار | 60,632 | 60,689 | → |
| Sabzevār | County | شهرستان سبزوار | 298,584 | 306,310 | → |
| Sarakhs | County | شهرستان سرخس | 89,956 | 97,519 | → |
| Ṭāybād | County | شهرستان تایباد | 108,424 | 117,564 | → |
| Torbat-e Ḥeydarīeh | County | شهرستان تربت حیدریه | 210,390 | 224,626 | → |
| Torbat-e Jām | County | شهرستان تربت جام | 262,712 | 267,671 | → |
| Zāveh | County | شهرستان زاوه | 71,677 | 67,695 | → |
| Iran | Islamic Republic | ایران | 75,149,669 | 79,926,270 |
Source: Statistical Centre of Iran (web).
Explanation: Area figures of counties are derived from geospatial data.
Further information about the population structure:
| Gender (C 2016) | |
|---|---|
| Males | 3,245,185 |
| Females | 3,189,316 |
| Age Groups (C 2016) | |
|---|---|
| 0-14 years | 1,728,562 |
| 15-64 years | 4,346,196 |
| 65+ years | 359,743 |
| Age Distribution (C 2016) | |
|---|---|
| 90+ years | 10,064 |
| 80-89 years | 71,878 |
| 70-79 years | 162,890 |
| 60-69 years | 300,689 |
| 50-59 years | 544,672 |
| 40-49 years | 776,687 |
| 30-39 years | 1,222,198 |
| 20-29 years | 1,154,731 |
| 10-19 years | 958,336 |
| 0-9 years | 1,232,356 |
| Urbanization (C 2016) | |
|---|---|
| Rural | 1,733,121 |
| Urban | 4,700,924 |
| Literacy (A6+) (C 2016) | |
|---|---|
| yes | 5,032,352 |
| no | 610,884 |
