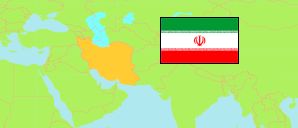
Gīlān
Province in Iran
Contents: Subdivision
The population development in Gīlān as well as related information and services (Wikipedia, Google, images).
| Name | Status | Native | Population Census 2011-10-24 | Population Census 2016-09-24 | |
|---|---|---|---|---|---|
| Gīlān | Province | گیلان | 2,480,874 | 2,530,696 | |
| Amlash | County | شهرستان املش | 44,261 | 43,225 | → |
| Āstāneh-e Ashrafiyeh | County | شهرستان آستانه اشرفیه | 105,526 | 108,130 | → |
| Āstārā | County | شهرستان آستارا | 86,757 | 91,257 | → |
| Bandar-e Anzalī | County | شهرستان بندر انزلی | 138,004 | 139,016 | → |
| Fūman | County | شهرستان فومن | 93,737 | 92,310 | → |
| Lāhījān | County | شهرستان لاهیجان | 168,829 | 167,544 | → |
| Langarūd | County | شهرستان لنگرود | 137,272 | 140,686 | → |
| Māsāl | County | شهرستان ماسال | 52,496 | 52,649 | → |
| Rasht | County | شهرستان رشت | 918,445 | 956,971 | → |
| Rezvānshahr | County | شهرستان رضوانشهر | 66,909 | 69,865 | → |
| Rūdbār | County | شهرستان رودبار | 100,943 | 94,720 | → |
| Rūdsar | County | شهرستان رودسر | 144,366 | 147,399 | → |
| Shaft | County | شهرستان شفت | 58,543 | 54,226 | → |
| Sīāhkal | County | شهرستان سیاهکل | 47,096 | 46,975 | → |
| Ṣowme'eh Sarā | County | شهرستان صومعه سرا | 127,757 | 125,074 | → |
| Ṭavālsh [Talesh] | County | شهرستان طوالش | 189,933 | 200,649 | → |
| Iran | Islamic Republic | ایران | 75,149,669 | 79,926,270 |
Source: Statistical Centre of Iran (web).
Explanation: Area figures of counties are derived from geospatial data.
Further information about the population structure:
| Gender (C 2016) | |
|---|---|
| Males | 1,267,597 |
| Females | 1,263,099 |
| Age Groups (C 2016) | |
|---|---|
| 0-14 years | 449,778 |
| 15-64 years | 1,856,261 |
| 65+ years | 224,657 |
| Age Distribution (C 2016) | |
|---|---|
| 90+ years | 5,028 |
| 80-89 years | 45,580 |
| 70-79 years | 95,306 |
| 60-69 years | 189,399 |
| 50-59 years | 309,233 |
| 40-49 years | 386,552 |
| 30-39 years | 472,837 |
| 20-29 years | 414,881 |
| 10-19 years | 315,141 |
| 0-9 years | 296,739 |
| Urbanization (C 2016) | |
|---|---|
| Rural | 927,660 |
| Urban | 1,603,026 |
| Literacy (A6+) (C 2016) | |
|---|---|
| yes | 2,056,087 |
| no | 298,199 |
