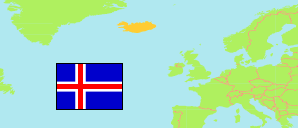
Iceland: Greater Reykjavik
Contents: Reykjavík
Urban Area
221,815 Population [2020] – estimate
239,733 Population [2024] – estimate
73.06km² Area
3,281/km² Density [2024]
Contents: Settlements
The population of the settlements of Greater Reykjavik (Stór-Reykjavík) according to official estimates.
| Name | Status | Population Estimate 2000-01-01 | Population Estimate 2005-01-01 | Population Estimate 2010-01-01 | Population Estimate 2015-01-01 | Population Estimate 2020-01-01 | Population Estimate 2024-01-01 | |
|---|---|---|---|---|---|---|---|---|
| Garðabær | Urban Settlement | 7,890 | 9,022 | 10,618 | 11,658 | 14,016 | 16,544 | → |
| Hafnarfjörður | Urban Settlement | 19,147 | 21,999 | 25,909 | 27,391 | 29,266 | 30,616 | → |
| Kópavogur | Urban Settlement | 22,405 | 25,785 | 30,327 | 32,595 | 37,017 | 39,261 | → |
| Mosfellsbær | Urban Settlement | 5,526 | 6,545 | 8,202 | 8,823 | 11,544 | 13,024 | → |
| Reykjavík | Urban Settlement | 109,215 | 112,979 | 117,465 | 117,902 | 125,376 | 135,714 | → |
| Seltjarnarnes | Urban Settlement | 4,665 | 4,548 | 4,395 | 4,308 | 4,593 | 4,572 | → |
| Reykjavík (Stór-Reykjavík) | Urban Area | 168,848 | 180,878 | 196,916 | 202,677 | 221,815 | 239,733 |
Source: Statistics Iceland.
Further information about the population structure:
| Gender (E 2024) | |
|---|---|
| Males | 121,584 |
| Females | 118,038 |
| Non-binary/Other | 111 |
| Age Groups (E 2024) | |
|---|---|
| 0-17 years | 52,781 |
| 18-64 years | 150,548 |
| 65+ years | 36,404 |
| Age Distribution (E 2024) | |
|---|---|
| 90+ years | 1,646 |
| 80-89 years | 6,940 |
| 70-79 years | 16,487 |
| 60-69 years | 24,068 |
| 50-59 years | 27,858 |
| 40-49 years | 32,661 |
| 30-39 years | 37,583 |
| 20-29 years | 33,667 |
| 10-19 years | 30,617 |
| 0-9 years | 28,206 |