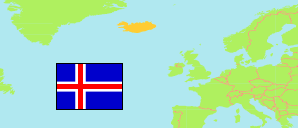
Norðurland eystra
Region in Iceland
Contents: Subdivision
The population development in Norðurland eystra as well as related information and services (Wikipedia, Google, images).
| Name | Status | Population Estimate 2000-01-01 | Population Estimate 2005-01-01 | Population Estimate 2010-01-01 | Population Estimate 2015-01-01 | Population Estimate 2020-01-01 | Population Estimate 2024-01-01 | |
|---|---|---|---|---|---|---|---|---|
| Norðurland eystra [Northeastern Region] | Region | 28,082 | 28,422 | 28,900 | 28,981 | 30,020 | 31,574 | |
| Akureyri | Municipality | 15,456 | 16,568 | 17,573 | 18,030 | 18,761 | 19,812 | → |
| Dalvíkurbyggð | Municipality | 2,050 | 1,944 | 1,949 | 1,849 | 1,870 | 1,866 | → |
| Eyjafjarðarsveit | Municipality | 964 | 993 | 1,025 | 1,016 | 1,060 | 1,162 | → |
| Fjallabyggð | Municipality | 2,633 | 2,371 | 2,066 | 2,021 | 1,986 | 1,973 | → |
| Grýtubakkahreppur | Municipality | 374 | 387 | 337 | 362 | 366 | 396 | → |
| Hörgársveit (Hörgárbyggð & Arnarneshreppur) | Municipality | 580 | 572 | 607 | 564 | 611 | 791 | → |
| Langanesbyggð | Municipality | 722 | 664 | 632 | 604 | 555 | 540 | → |
| Norðurþing | Municipality | 3,390 | 3,094 | 2,926 | 2,768 | 2,997 | 3,081 | → |
| Svalbarðsstrandarhreppur | Municipality | 341 | 366 | 413 | 407 | 440 | 491 | → |
| Þingeyjarsveit | Municipality | 1,499 | 1,399 | 1,316 | 1,301 | 1,321 | 1,410 | → |
| Tjörneshreppur | Municipality | 73 | 64 | 56 | 59 | 53 | 52 | → |
| Ísland [Iceland] | Country | 279,049 | 293,577 | 317,630 | 323,024 | 354,042 | 383,726 |
Source: Statistics Iceland.
Further information about the population structure:
| Gender (E 2024) | |
|---|---|
| Males | 16,045 |
| Females | 15,514 |
| Non-binary/Other | 15 |
| Age Groups (E 2024) | |
|---|---|
| 0-17 years | 6,971 |
| 18-64 years | 19,017 |
| 65+ years | 5,586 |
| Age Distribution (E 2024) | |
|---|---|
| 90+ years | 251 |
| 80-89 years | 1,088 |
| 70-79 years | 2,536 |
| 60-69 years | 3,683 |
| 50-59 years | 3,861 |
| 40-49 years | 3,725 |
| 30-39 years | 4,224 |
| 20-29 years | 4,419 |
| 10-19 years | 4,173 |
| 0-9 years | 3,614 |
| Citizenship (E 2023) | |
|---|---|
| Iceland | 28,570 |
| Foreign Citizenship | 3,215 |
