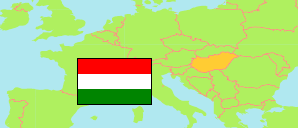
Baktalórántháza
District in Szabolcs-Szatmár-Bereg
District
The population development of Baktalórántháza.
| Name | Status | Population Census 1980-01-01 | Population Census 1990-01-01 | Population Census 2001-02-01 | Population Census 2011-10-01 | Population Census 2022-10-01 | |
|---|---|---|---|---|---|---|---|
| Baktalórántháza | District | 20,533 | 18,978 | 20,067 | 19,123 | 17,398 | → |
| Szabolcs-Szatmár-Bereg | County | 593,829 | 572,301 | 582,256 | 559,272 | 529,381 |
Contents: Towns and Villages
The population development of the towns and villages in Baktalórántháza.
| Name | Status | District | Population Census 1980-01-01 | Population Census 1990-01-01 | Population Census 2001-02-01 | Population Census 2011-10-01 | Population Census 2022-10-01 | |
|---|---|---|---|---|---|---|---|---|
| Baktalórántháza | Town | Baktalórántháza | 4,044 | 3,857 | 4,136 | 3,916 | 3,420 | → |
| Besenyőd | Village | Baktalórántháza | 688 | 572 | 699 | 669 | 652 | → |
| Laskod | Village | Baktalórántháza | 1,211 | 1,107 | 1,068 | 1,004 | 788 | → |
| Levelek | Large Village | Baktalórántháza | 2,400 | 2,557 | 2,861 | 2,880 | 2,677 | → |
| Magy | Village | Baktalórántháza | 1,122 | 946 | 988 | 917 | 846 | → |
| Nyíribrony | Village | Baktalórántháza | 1,307 | 1,128 | 1,123 | 1,057 | 1,030 | → |
| Nyírjákó | Village | Baktalórántháza | 1,090 | 958 | 930 | 870 | 807 | → |
| Nyírkércs | Village | Baktalórántháza | 939 | 849 | 828 | 794 | 702 | → |
| Ófehértó | Village | Baktalórántháza | 2,802 | 2,543 | 2,680 | 2,515 | 2,417 | → |
| Petneháza | Village | Baktalórántháza | 1,984 | 1,756 | 1,949 | 1,785 | 1,529 | → |
| Ramocsaháza | Village | Baktalórántháza | 1,564 | 1,420 | 1,499 | 1,517 | 1,371 | → |
| Rohod | Village | Baktalórántháza | 1,382 | 1,285 | 1,306 | 1,199 | 1,159 | → |
Source: Hungarian Central Statistical Office.
Explanation: 2022 census results are final.
