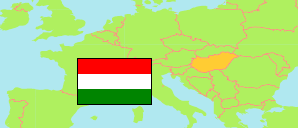
Szeged
District in Csongrád-Csanád
District
The population development of Szeged.
| Name | Status | Population Census 1980-01-01 | Population Census 1990-01-01 | Population Census 2001-02-01 | Population Census 2011-10-01 | Population Census 2022-10-01 | Population Estimate 2025-01-01 | |
|---|---|---|---|---|---|---|---|---|
| Szeged | District | 197,370 | 200,970 | 203,636 | 204,263 | 196,544 | 194,693 | → |
| Csongrád-Csanád | County | 456,300 | 438,842 | 433,344 | 417,456 | 391,184 | 388,106 |
Contents: Towns and Villages
The population development of the towns and villages in Szeged.
| Name | Status | District | Population Census 1980-01-01 | Population Census 1990-01-01 | Population Census 2001-02-01 | Population Census 2011-10-01 | Population Census 2022-10-01 | Population Estimate 2025-01-01 | |
|---|---|---|---|---|---|---|---|---|---|
| Algyő | Large Village | Szeged | 6,357 | 5,371 | 5,862 | 5,508 | 5,898 | 5,364 | → |
| Deszk | Village | Szeged | 2,777 | 2,755 | 3,238 | 3,560 | 3,868 | 3,990 | → |
| Dóc | Village | Szeged | 902 | 805 | 823 | 733 | 674 | 661 | → |
| Domaszék | Village | Szeged | 3,313 | 3,178 | 4,166 | 4,862 | 4,823 | 4,753 | → |
| Ferencszállás | Village | Szeged | 748 | 701 | 659 | 623 | 625 | 603 | → |
| Klárafalva | Village | Szeged | 538 | 497 | 485 | 473 | 460 | 425 | → |
| Kübekháza | Village | Szeged | 1,617 | 1,455 | 1,535 | 1,463 | 1,470 | 1,432 | → |
| Röszke | Village | Szeged | 3,462 | 2,979 | 3,166 | 3,086 | 3,327 | 3,386 | → |
| Sándorfalva | Town | Szeged | 6,399 | 6,933 | 7,803 | 7,871 | 8,127 | 8,196 | → |
| Szatymaz | Village | Szeged | 3,781 | 3,469 | 4,276 | 4,658 | 4,944 | 4,957 | → |
| Szeged | Town with County Rights | Szeged | 164,437 | 169,930 | 168,273 | 168,048 | 158,797 | 157,282 | → |
| Tiszasziget | Village | Szeged | 1,693 | 1,567 | 1,700 | 1,708 | 1,656 | 1,675 | → |
| Újszentiván | Village | Szeged | 1,346 | 1,330 | 1,650 | 1,670 | 1,875 | 1,969 | → |
Source: Hungarian Central Statistical Office.
Explanation: 2022 census results are final.