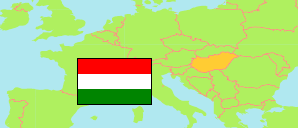
Kiskunmajsa
District in Hungary
Contents: Population
The population development of Kiskunmajsa as well as related information and services (Wikipedia, Google, images).
| Name | Status | Population Census 1980-01-01 | Population Census 1990-01-01 | Population Census 2001-02-01 | Population Census 2011-10-01 | Population Census 2022-10-01 | |
|---|---|---|---|---|---|---|---|
| Kiskunmajsa | District | 23,006 | 20,848 | 20,477 | 18,908 | 18,241 | |
| Magyarország [Hungary] | Country | 10,709,463 | 10,374,823 | 10,198,315 | 9,937,628 | 9,603,634 |
Source: Hungarian Central Statistical Office.
Explanation: 2022 census results are final.
Further information about the population structure:
| Gender (C 2022) | |
|---|---|
| Males | 8,812 |
| Females | 9,429 |
| Age Groups (C 2022) | |
|---|---|
| 0-17 years | 3,339 |
| 18-64 years | 10,959 |
| 65+ years | 3,943 |
| Age Distribution (C 2022) | |
|---|---|
| 90+ years | 121 |
| 80-89 years | 846 |
| 70-79 years | 1,773 |
| 60-69 years | 2,413 |
| 50-59 years | 2,547 |
| 40-49 years | 2,744 |
| 30-39 years | 2,164 |
| 20-29 years | 1,919 |
| 10-19 years | 1,794 |
| 0-9 years | 1,920 |
