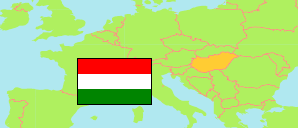
Zala
County in Hungary
Contents: Subdivision
The population development in Zala as well as related information and services (Wikipedia, Google, images).
| Name | Status | Population Census 1980-01-01 | Population Census 1990-01-01 | Population Census 2001-02-01 | Population Census 2011-10-01 | Population Census 2022-10-01 | |
|---|---|---|---|---|---|---|---|
| Zala | County | 317,298 | 306,398 | 297,404 | 282,179 | 260,800 | |
| Keszthely | District | 49,867 | 47,960 | 48,976 | 49,421 | 48,288 | → |
| Lenti | District | 26,851 | 24,146 | 21,955 | 19,789 | 18,019 | → |
| Letenye | District | 21,804 | 19,776 | 18,450 | 16,410 | 14,499 | → |
| Nagykanizsa | District | 89,552 | 86,859 | 83,744 | 78,252 | 70,494 | → |
| Zalaegerszeg | District | 109,032 | 109,614 | 107,264 | 102,798 | 95,237 | → |
| Zalaszentgrót | District | 20,192 | 18,043 | 17,015 | 15,509 | 14,263 | → |
| Magyarország [Hungary] | Country | 10,709,463 | 10,374,823 | 10,198,315 | 9,937,628 | 9,603,634 |
Source: Hungarian Central Statistical Office.
Explanation: 2022 census results are final.
Further information about the population structure:
| Gender (C 2022) | |
|---|---|
| Males | 124,974 |
| Females | 135,826 |
| Age Groups (C 2022) | |
|---|---|
| 0-17 years | 39,957 |
| 18-64 years | 157,733 |
| 65+ years | 63,110 |
| Age Distribution (C 2022) | |
|---|---|
| 90+ years | 1,753 |
| 80-89 years | 11,670 |
| 70-79 years | 28,059 |
| 60-69 years | 40,422 |
| 50-59 years | 37,862 |
| 40-49 years | 42,541 |
| 30-39 years | 29,627 |
| 20-29 years | 24,336 |
| 10-19 years | 23,488 |
| 0-9 years | 21,042 |
