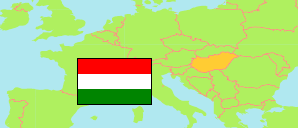
Szabolcs-Szatmár-Bereg
County in Hungary
Contents: Subdivision
The population development in Szabolcs-Szatmár-Bereg as well as related information and services (Wikipedia, Google, images).
| Name | Status | Population Census 1980-01-01 | Population Census 1990-01-01 | Population Census 2001-02-01 | Population Census 2011-10-01 | Population Census 2022-10-01 | |
|---|---|---|---|---|---|---|---|
| Szabolcs-Szatmár-Bereg | County | 593,829 | 572,301 | 582,256 | 559,272 | 529,381 | |
| Baktalórántháza | District | 20,533 | 18,978 | 20,067 | 19,123 | 17,398 | → |
| Csenger | District | 16,140 | 14,526 | 14,504 | 13,485 | 12,538 | → |
| Fehérgyarmat | District | 44,233 | 40,063 | 39,683 | 37,259 | 35,358 | → |
| Ibrány | District | 27,269 | 24,966 | 24,919 | 23,679 | 21,954 | → |
| Kemecse | District | 23,279 | 22,026 | 22,853 | 22,066 | 20,618 | → |
| Kisvárda | District | 61,118 | 58,341 | 58,721 | 56,114 | 51,413 | → |
| Mátészalka | District | 69,482 | 67,078 | 67,675 | 64,015 | 60,077 | → |
| Nagykálló | District | 34,874 | 32,248 | 32,526 | 30,403 | 28,447 | → |
| Nyírbátor | District | 47,355 | 44,881 | 45,207 | 43,040 | 39,865 | → |
| Nyíregyháza | District | 157,990 | 162,137 | 169,091 | 168,118 | 162,969 | → |
| Tiszavasvári | District | 29,976 | 28,630 | 29,002 | 27,684 | 26,260 | → |
| Vásárosnamény | District | 40,916 | 37,780 | 37,530 | 35,323 | 34,880 | → |
| Záhony | District | 20,664 | 20,647 | 20,478 | 18,963 | 17,604 | → |
| Magyarország [Hungary] | Country | 10,709,463 | 10,374,823 | 10,198,315 | 9,937,628 | 9,603,634 |
Source: Hungarian Central Statistical Office.
Explanation: 2022 census results are final.
Further information about the population structure:
| Gender (C 2022) | |
|---|---|
| Males | 257,107 |
| Females | 272,274 |
| Age Groups (C 2022) | |
|---|---|
| 0-17 years | 105,210 |
| 18-64 years | 329,065 |
| 65+ years | 95,106 |
| Age Distribution (C 2022) | |
|---|---|
| 90+ years | 2,191 |
| 80-89 years | 15,731 |
| 70-79 years | 42,646 |
| 60-69 years | 67,439 |
| 50-59 years | 70,754 |
| 40-49 years | 81,501 |
| 30-39 years | 67,143 |
| 20-29 years | 64,873 |
| 10-19 years | 58,161 |
| 0-9 years | 58,942 |
