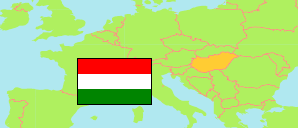
Pest
County in Hungary
Contents: Subdivision
The population development in Pest as well as related information and services (Wikipedia, Google, images).
| Name | Status | Population Census 1980-01-01 | Population Census 1990-01-01 | Population Census 2001-02-01 | Population Census 2011-10-01 | Population Census 2022-10-01 | |
|---|---|---|---|---|---|---|---|
| Pest | County | 973,830 | 949,842 | 1,083,877 | 1,217,476 | 1,333,533 | |
| Aszód | District | 37,945 | 35,463 | 37,983 | 37,472 | 37,754 | → |
| Budakeszi | District | 53,974 | 55,772 | 68,392 | 83,670 | 97,202 | → |
| Cegléd | District | 94,691 | 87,780 | 91,411 | 88,952 | 89,586 | → |
| Dabas | District | 44,149 | 43,129 | 47,194 | 48,289 | 50,460 | → |
| Dunakeszi | District | 52,712 | 52,913 | 61,788 | 78,634 | 88,992 | → |
| Érd | District | 78,385 | 81,913 | 101,627 | 116,510 | 130,158 | → |
| Gödöllő | District | 97,184 | 96,994 | 116,302 | 139,826 | 160,239 | → |
| Gyál | District | 34,054 | 32,326 | 37,662 | 40,853 | 43,155 | → |
| Monor | District | 55,000 | 52,574 | 60,048 | 65,983 | 73,304 | → |
| Nagykáta | District | 70,503 | 65,691 | 71,635 | 71,992 | 73,346 | → |
| Nagykőrös | District | 32,173 | 30,716 | 29,288 | 27,977 | 26,983 | → |
| Pilisvörösvár | District | 35,190 | 34,732 | 43,866 | 53,201 | 58,432 | → |
| Ráckeve | District | 33,817 | 31,810 | 34,321 | 35,732 | 38,690 | → |
| Szentendre | District | 54,253 | 56,726 | 67,489 | 77,802 | 88,937 | → |
| Szigetszentmiklós | District | 70,383 | 69,918 | 83,898 | 110,448 | 129,550 | → |
| Szob | District | 25,186 | 23,235 | 24,363 | 24,875 | 25,501 | → |
| Vác | District | 62,216 | 60,095 | 65,121 | 68,234 | 70,659 | → |
| Vecsés | District | 42,015 | 38,055 | 41,489 | 47,026 | 50,585 | → |
| Magyarország [Hungary] | Country | 10,709,463 | 10,374,823 | 10,198,315 | 9,937,628 | 9,603,634 |
Source: Hungarian Central Statistical Office.
Explanation: 2022 census results are final.
Further information about the population structure:
| Gender (C 2022) | |
|---|---|
| Males | 648,200 |
| Females | 685,333 |
| Age Groups (C 2022) | |
|---|---|
| 0-17 years | 270,846 |
| 18-64 years | 823,807 |
| 65+ years | 238,880 |
| Age Distribution (C 2022) | |
|---|---|
| 90+ years | 6,095 |
| 80-89 years | 42,601 |
| 70-79 years | 111,025 |
| 60-69 years | 146,980 |
| 50-59 years | 180,374 |
| 40-49 years | 239,387 |
| 30-39 years | 172,430 |
| 20-29 years | 135,883 |
| 10-19 years | 149,337 |
| 0-9 years | 149,421 |
