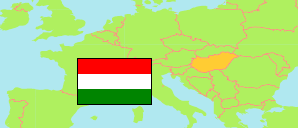
Győr-Moson-Sopron
County in Hungary
Contents: Subdivision
The population development in Győr-Moson-Sopron as well as related information and services (Wikipedia, Google, images).
| Name | Status | Population Census 1980-01-01 | Population Census 1990-01-01 | Population Census 2001-02-01 | Population Census 2011-10-01 | Population Census 2022-10-01 | |
|---|---|---|---|---|---|---|---|
| Győr-Moson-Sopron | County | 437,857 | 432,126 | 438,773 | 447,985 | 465,945 | |
| Csorna | District | 38,087 | 35,327 | 34,445 | 32,970 | 31,966 | → |
| Győr | District | 175,909 | 180,366 | 184,406 | 190,146 | 198,835 | → |
| Kapuvár | District | 29,346 | 27,136 | 25,967 | 24,678 | 24,070 | → |
| Mosonmagyaróvár | District | 68,574 | 68,535 | 70,018 | 72,609 | 79,480 | → |
| Pannonhalma | District | 17,000 | 15,277 | 15,665 | 15,227 | 15,317 | → |
| Sopron | District | 92,356 | 90,357 | 93,430 | 97,941 | 101,206 | → |
| Tét | District | 16,585 | 15,128 | 14,842 | 14,414 | 15,071 | → |
| Magyarország [Hungary] | Country | 10,709,463 | 10,374,823 | 10,198,315 | 9,937,628 | 9,603,634 |
Source: Hungarian Central Statistical Office.
Explanation: 2022 census results are final.
Further information about the population structure:
| Gender (C 2022) | |
|---|---|
| Males | 226,957 |
| Females | 238,988 |
| Age Groups (C 2022) | |
|---|---|
| 0-17 years | 83,144 |
| 18-64 years | 292,978 |
| 65+ years | 89,823 |
| Age Distribution (C 2022) | |
|---|---|
| 90+ years | 2,435 |
| 80-89 years | 16,493 |
| 70-79 years | 40,610 |
| 60-69 years | 56,539 |
| 50-59 years | 62,170 |
| 40-49 years | 81,689 |
| 30-39 years | 63,049 |
| 20-29 years | 50,551 |
| 10-19 years | 46,544 |
| 0-9 years | 45,865 |
