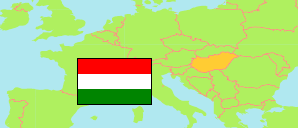
Borsod-Abaúj-Zemplén
County in Hungary
Contents: Subdivision
The population development in Borsod-Abaúj-Zemplén as well as related information and services (Wikipedia, Google, images).
| Name | Status | Population Census 1980-01-01 | Population Census 1990-01-01 | Population Census 2001-02-01 | Population Census 2011-10-01 | Population Census 2022-10-01 | |
|---|---|---|---|---|---|---|---|
| Borsod-Abaúj-Zemplén | County | 809,468 | 761,963 | 744,404 | 686,266 | 623,024 | |
| Cigánd | District | 21,530 | 18,187 | 17,376 | 16,042 | 14,767 | → |
| Edelény | District | 38,682 | 35,586 | 36,246 | 33,314 | 31,615 | → |
| Encs | District | 21,825 | 20,823 | 21,665 | 21,390 | 21,059 | → |
| Gönc | District | 21,960 | 19,092 | 18,710 | 16,783 | 15,665 | → |
| Kazincbarcika | District | 81,293 | 76,961 | 73,199 | 66,470 | 58,445 | → |
| Mezőcsát | District | 16,628 | 15,739 | 15,636 | 14,446 | 13,515 | → |
| Mezőkövesd | District | 50,529 | 47,556 | 46,048 | 42,434 | 38,899 | → |
| Miskolc | District | 283,878 | 274,953 | 268,437 | 250,530 | 227,095 | → |
| Ózd | District | 71,759 | 64,649 | 60,893 | 54,285 | 49,038 | → |
| Putnok | District | 23,317 | 21,347 | 21,237 | 19,290 | 17,145 | → |
| Sárospatak | District | 31,239 | 28,689 | 27,931 | 24,946 | 21,154 | → |
| Sátoraljaújhely | District | 30,922 | 27,869 | 26,577 | 23,058 | 20,099 | → |
| Szerencs | District | 45,054 | 43,243 | 44,066 | 40,598 | 36,715 | → |
| Szikszó | District | 20,295 | 18,491 | 18,667 | 17,507 | 17,173 | → |
| Tiszaújváros | District | 32,793 | 32,701 | 32,810 | 31,842 | 29,438 | → |
| Tokaj | District | 17,764 | 16,077 | 14,906 | 13,331 | 11,202 | → |
| Magyarország [Hungary] | Country | 10,709,463 | 10,374,823 | 10,198,315 | 9,937,628 | 9,603,634 |
Source: Hungarian Central Statistical Office.
Explanation: 2022 census results are final.
Further information about the population structure:
| Gender (C 2022) | |
|---|---|
| Males | 300,508 |
| Females | 322,516 |
| Age Groups (C 2022) | |
|---|---|
| 0-17 years | 122,181 |
| 18-64 years | 378,641 |
| 65+ years | 122,202 |
| Age Distribution (C 2022) | |
|---|---|
| 90+ years | 2,976 |
| 80-89 years | 23,406 |
| 70-79 years | 53,691 |
| 60-69 years | 81,726 |
| 50-59 years | 83,288 |
| 40-49 years | 90,273 |
| 30-39 years | 77,711 |
| 20-29 years | 74,416 |
| 10-19 years | 66,148 |
| 0-9 years | 69,389 |
