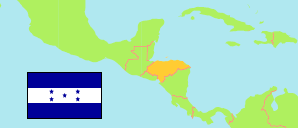
El Corpus
Municipality in Honduras
Contents: Population
The population development of El Corpus as well as related information and services (Wikipedia, Google, images).
| Name | Status | Population Census 2001-07-28 | Population Census 2013-08-10 | Population Projection 2023-07-01 | |
|---|---|---|---|---|---|
| El Corpus | Municipality | 22,213 | 24,646 | 27,112 | |
| Honduras | Republic | 6,535,344 | 8,303,771 | 9,745,149 |
Source: Instituto Nacional de Estadística Honduras (web).
Explanation: All population figures are adjusted for underenumeration.
Further information about the population structure:
| Gender (P 2023) | |
|---|---|
| Males | 14,417 |
| Females | 12,696 |
| Age Groups (P 2023) | |
|---|---|
| 0-14 years | 7,596 |
| 15-64 years | 17,053 |
| 65+ years | 2,463 |
| Age Distribution (P 2023) | |
|---|---|
| 80+ years | 615 |
| 70-79 years | 1,038 |
| 60-69 years | 1,740 |
| 50-59 years | 2,219 |
| 40-49 years | 2,969 |
| 30-39 years | 4,187 |
| 20-29 years | 4,439 |
| 10-19 years | 4,768 |
| 0-9 years | 5,137 |
| Urbanization (P 2023) | |
|---|---|
| Rural | 27,112 |
| Place of Birth (C 2013) | |
|---|---|
| Same municipality | 22,776 |
| Other municipality in Honduras | 1,841 |
| Other country | 29 |
| Ethnic Group (C 2013) | |
|---|---|
| Indigenous | 185 |
| Non-Indigenous | 24,460 |