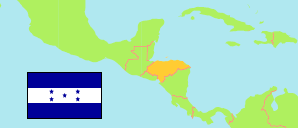
Ocotepeque
Department in Honduras
Contents: Subdivision
The population development in Ocotepeque as well as related information and services (Wikipedia, Google, images).
| Name | Status | Population Census 2001-07-28 | Population Census 2013-08-10 | Population Projection 2023-07-01 | |
|---|---|---|---|---|---|
| Ocotepeque | Department | 108,029 | 146,430 | 174,179 | |
| Belén Gualcho | Municipality | 12,860 | 15,438 | 18,305 | → |
| Concepción | Municipality | 3,986 | 5,074 | 6,024 | → |
| Dolores Merendón | Municipality | 2,310 | 3,742 | 5,265 | → |
| Fraternidad | Municipality | 2,265 | 4,890 | 8,571 | → |
| La Encarnación | Municipality | 4,327 | 4,961 | 5,935 | → |
| La Labor | Municipality | 6,602 | 9,515 | 11,268 | → |
| Lucerna | Municipality | 3,672 | 5,861 | 6,570 | → |
| Mercedes | Municipality | 6,000 | 7,226 | 7,876 | → |
| Ocotepeque | Municipality | 17,441 | 23,096 | 27,440 | → |
| San Fernando | Municipality | 5,015 | 6,948 | 7,499 | → |
| San Francisco del Valle | Municipality | 6,469 | 9,625 | 10,635 | → |
| San Jorge | Municipality | 4,100 | 5,037 | 5,802 | → |
| San Marcos | Municipality | 14,453 | 19,978 | 23,751 | → |
| Santa Fe | Municipality | 3,758 | 4,851 | 5,690 | → |
| Sensenti | Municipality | 8,618 | 11,453 | 12,461 | → |
| Sinuapa | Municipality | 6,153 | 8,735 | 11,088 | → |
| Honduras | Republic | 6,535,344 | 8,303,771 | 9,745,149 |
Source: Instituto Nacional de Estadística Honduras (web).
Explanation: All population figures are adjusted for underenumeration.
Further information about the population structure:
| Gender (P 2023) | |
|---|---|
| Males | 86,015 |
| Females | 88,164 |
| Age Groups (P 2023) | |
|---|---|
| 0-14 years | 51,854 |
| 15-64 years | 111,759 |
| 65+ years | 10,566 |
| Age Distribution (P 2023) | |
|---|---|
| 80+ years | 2,380 |
| 70-79 years | 4,617 |
| 60-69 years | 8,049 |
| 50-59 years | 12,366 |
| 40-49 years | 18,561 |
| 30-39 years | 26,450 |
| 20-29 years | 32,658 |
| 10-19 years | 34,212 |
| 0-9 years | 34,886 |
| Urbanization (P 2023) | |
|---|---|
| Rural | 121,758 |
| Urban | 52,421 |
| Place of Birth (C 2013) | |
|---|---|
| Same municipality | 122,707 |
| Other municipality in Honduras | 22,433 |
| Other country | 1,290 |
| Ethnic Group (C 2013) | |
|---|---|
| Indigenous | 16,285 |
| Non-Indigenous | 130,143 |
