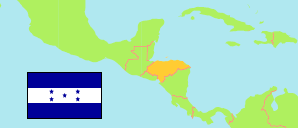
Cortés
Department in Honduras
Contents: Subdivision
The population development in Cortés as well as related information and services (Wikipedia, Google, images).
| Name | Status | Population Census 2001-07-28 | Population Census 2013-08-10 | Population Projection 2023-07-01 | |
|---|---|---|---|---|---|
| Cortés | Department | 1,202,510 | 1,562,394 | 1,886,695 | |
| Choloma | Municipality | 176,789 | 231,668 | 296,952 | → |
| La Lima | Municipality | 62,443 | 71,910 | 89,810 | → |
| Omoa | Municipality | 33,559 | 45,179 | 58,172 | → |
| Pimienta | Municipality | 13,127 | 18,557 | 23,701 | → |
| Potrerillos | Municipality | 18,945 | 23,678 | 26,954 | → |
| Puerto Cortés | Municipality | 103,033 | 122,426 | 142,311 | → |
| San Antonio de Cortés | Municipality | 19,969 | 22,135 | 23,332 | → |
| San Francisco de Yojoa | Municipality | 15,098 | 21,955 | 26,035 | → |
| San Manuel | Municipality | 34,320 | 53,083 | 76,612 | → |
| San Pedro Sula | Municipality | 567,713 | 719,064 | 834,883 | → |
| Santa Cruz de Yojoa | Municipality | 65,901 | 82,760 | 97,848 | → |
| Villanueva | Municipality | 91,613 | 149,977 | 190,085 | → |
| Honduras | Republic | 6,535,344 | 8,303,771 | 9,745,149 |
Source: Instituto Nacional de Estadística Honduras (web).
Explanation: All population figures are adjusted for underenumeration.
Further information about the population structure:
| Gender (P 2023) | |
|---|---|
| Males | 903,029 |
| Females | 983,666 |
| Age Groups (P 2023) | |
|---|---|
| 0-14 years | 543,576 |
| 15-64 years | 1,243,015 |
| 65+ years | 100,104 |
| Age Distribution (P 2023) | |
|---|---|
| 80+ years | 21,409 |
| 70-79 years | 43,534 |
| 60-69 years | 81,104 |
| 50-59 years | 135,188 |
| 40-49 years | 217,851 |
| 30-39 years | 313,547 |
| 20-29 years | 345,408 |
| 10-19 years | 367,131 |
| 0-9 years | 361,523 |
| Urbanization (P 2023) | |
|---|---|
| Rural | 314,702 |
| Urban | 1,571,993 |
| Place of Birth (C 2013) | |
|---|---|
| Same municipality | 996,235 |
| Other municipality in Honduras | 558,488 |
| Other country | 7,672 |
| Ethnic Group (C 2013) | |
|---|---|
| Indigenous | 41,572 |
| Non-Indigenous | 1,520,820 |