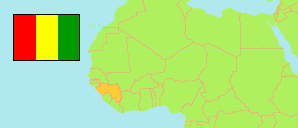
Beyla
Prefecture in Guinea
Contents: Subdivision
The population development in Beyla as well as related information and services (Wikipedia, Google, images).
| Name | Status | Population Census 1996-12-31 | Population Census 2014-03-01 | |
|---|---|---|---|---|
| Beyla | Prefecture | 169,730 | 326,082 | |
| Beyla-Centre | Urban Commune | 17,264 | 32,212 | → |
| Boola | Sub-Prefecture | 15,323 | 22,542 | → |
| Diara-Guerela | Sub-Prefecture | 4,573 | 11,340 | → |
| Diassadou | Sub-Prefecture | 5,870 | 16,922 | → |
| Fouala | Sub-Prefecture | 9,174 | 16,619 | → |
| Gbackédou | Sub-Prefecture | 13,567 | 22,474 | → |
| Gbéssoba | Sub-Prefecture | 17,977 | 35,372 | → |
| Karala | Sub-Prefecture | 4,786 | 10,815 | → |
| Koumandou | Sub-Prefecture | 7,686 | 13,119 | → |
| Moussadou | Sub-Prefecture | 6,683 | 15,638 | → |
| Nionsomoridou | Sub-Prefecture | 7,557 | 15,627 | → |
| Samana | Sub-Prefecture | 10,473 | 24,213 | → |
| Sinko | Sub-Prefecture | 40,276 | 80,104 | → |
| Sokourala | Sub-Prefecture | 5,001 | 9,085 | → |
| Guinea | Republic | 7,156,406 | 10,523,261 |
Source: Institut National de la Statistique de Guinée (web).
Explanation: The 1996 population of sub-prefectures and urban communes shows slight discrepancies compared to the population of prefectures.
Further information about the population structure:
| Gender (C 2014) | |
|---|---|
| Males | 159,859 |
| Females | 166,223 |
| Age Groups (P 2014) | |
|---|---|
| 0-14 years | 182,481 |
| 15-64 years | 174,798 |
| 65+ years | 11,660 |
| Age Distribution (P 2014) | |
|---|---|
| 0-9 years | 139,045 |
| 10-19 years | 78,294 |
| 20-29 years | 52,697 |
| 30-39 years | 40,143 |
| 40-49 years | 25,511 |
| 50-59 years | 15,897 |
| 60-69 years | 10,055 |
| 70-79 years | 4,965 |
| 80+ years | 2,332 |
| Urbanization (C 2014) | |
|---|---|
| Rural | 308,986 |
| Urban | 17,096 |