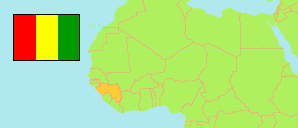
Pita
Prefecture in Guinea
Contents: Subdivision
The population development in Pita as well as related information and services (Wikipedia, Google, images).
| Name | Status | Population Census 1996-12-31 | Population Census 2014-03-01 | |
|---|---|---|---|---|
| Pita | Prefecture | 239,236 | 278,530 | |
| Bantignel | Sub-Prefecture | 14,883 | 14,032 | → |
| Bourouwal-Tappé | Sub-Prefecture | 10,199 | 9,740 | → |
| Dongol-Touma | Sub-Prefecture | 22,051 | 23,569 | → |
| Gongore | Sub-Prefecture | 20,680 | 16,876 | → |
| Ley-Miro | Sub-Prefecture | 17,371 | 19,375 | → |
| Maci | Sub-Prefecture | 19,116 | 21,977 | → |
| Ninguélandé | Sub-Prefecture | 25,583 | 25,868 | → |
| Pita-Centre | Urban Commune | 19,489 | 28,124 | → |
| Sangaréah | Sub-Prefecture | 24,950 | 37,165 | → |
| Sintali | Sub-Prefecture | 8,524 | 9,097 | → |
| Timbi-Madina | Sub-Prefecture | 36,648 | 51,988 | → |
| Timbi-Touny | Sub-Prefecture | 19,990 | 20,719 | → |
| Guinea | Republic | 7,156,406 | 10,523,261 |
Source: Institut National de la Statistique de Guinée (web).
Explanation: The 1996 population of sub-prefectures and urban communes shows slight discrepancies compared to the population of prefectures.
Further information about the population structure:
| Gender (C 2014) | |
|---|---|
| Males | 123,999 |
| Females | 154,531 |
| Age Groups (P 2014) | |
|---|---|
| 0-14 years | 133,145 |
| 15-64 years | 158,584 |
| 65+ years | 22,740 |
| Age Distribution (P 2014) | |
|---|---|
| 0-9 years | 93,273 |
| 10-19 years | 66,659 |
| 20-29 years | 39,465 |
| 30-39 years | 34,359 |
| 40-49 years | 27,233 |
| 50-59 years | 22,143 |
| 60-69 years | 16,715 |
| 70-79 years | 10,528 |
| 80+ years | 4,094 |
| Urbanization (C 2014) | |
|---|---|
| Rural | 256,691 |
| Urban | 21,839 |