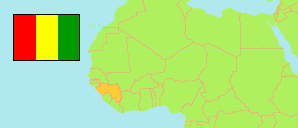
Dinguiraye
Prefecture in Guinea
Contents: Subdivision
The population development in Dinguiraye as well as related information and services (Wikipedia, Google, images).
| Name | Status | Population Census 1996-12-31 | Population Census 2014-03-01 | |
|---|---|---|---|---|
| Dinguiraye | Prefecture | 137,380 | 196,469 | |
| Banora | Sub-Prefecture | 21,559 | 33,823 | → |
| Dialakoro | Sub-Prefecture | 10,782 | 14,882 | → |
| Diatiféré | Sub-Prefecture | 19,994 | 33,658 | → |
| Dinguiraye-Centre | Urban Commune | 30,753 | 47,207 | → |
| Gagnakali | Sub-Prefecture | 9,654 | 12,659 | → |
| Kalinko | Sub-Prefecture | 26,630 | 31,970 | → |
| Lansanya | Sub-Prefecture | 7,925 | 9,106 | → |
| Sélouma | Sub-Prefecture | 10,697 | 13,164 | → |
| Guinea | Republic | 7,156,406 | 10,523,261 |
Source: Institut National de la Statistique de Guinée (web).
Explanation: The 1996 population of sub-prefectures and urban communes shows slight discrepancies compared to the population of prefectures.
Further information about the population structure:
| Gender (C 2014) | |
|---|---|
| Males | 94,387 |
| Females | 102,082 |
| Age Groups (P 2014) | |
|---|---|
| 0-14 years | 110,630 |
| 15-64 years | 102,904 |
| 65+ years | 8,672 |
| Age Distribution (P 2014) | |
|---|---|
| 0-9 years | 80,067 |
| 10-19 years | 50,004 |
| 20-29 years | 28,041 |
| 30-39 years | 23,558 |
| 40-49 years | 16,369 |
| 50-59 years | 11,403 |
| 60-69 years | 7,598 |
| 70-79 years | 3,771 |
| 80+ years | 1,395 |
| Urbanization (C 2014) | |
|---|---|
| Rural | 178,387 |
| Urban | 18,082 |