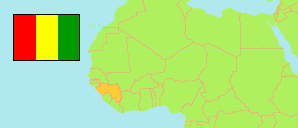
Koundara
Prefecture in Guinea
Contents: Subdivision
The population development in Koundara as well as related information and services (Wikipedia, Google, images).
| Name | Status | Population Census 1996-12-31 | Population Census 2014-03-01 | |
|---|---|---|---|---|
| Koundara | Prefecture | 90,230 | 129,974 | |
| Guingan | Sub-Prefecture | 12,150 | 14,293 | → |
| Kamaby | Sub-Prefecture | 10,399 | 16,129 | → |
| Koundara-Centre | Urban Commune | 16,599 | 27,296 | → |
| Sambailo | Sub-Prefecture | 10,563 | 15,667 | → |
| Saréboido | Sub-Prefecture | 22,740 | 33,508 | → |
| Termesse | Sub-Prefecture | 9,829 | 15,267 | → |
| Youkounkoun | Sub-Prefecture | 6,420 | 7,814 | → |
| Guinea | Republic | 7,156,406 | 10,523,261 |
Source: Institut National de la Statistique de Guinée (web).
Explanation: The 1996 population of sub-prefectures and urban communes shows slight discrepancies compared to the population of prefectures.
Further information about the population structure:
| Gender (C 2014) | |
|---|---|
| Males | 63,167 |
| Females | 66,807 |
| Age Groups (P 2014) | |
|---|---|
| 0-14 years | 65,401 |
| 15-64 years | 75,956 |
| 65+ years | 5,586 |
| Age Distribution (P 2014) | |
|---|---|
| 0-9 years | 46,317 |
| 10-19 years | 34,573 |
| 20-29 years | 23,447 |
| 30-39 years | 16,662 |
| 40-49 years | 10,833 |
| 50-59 years | 7,012 |
| 60-69 years | 4,582 |
| 70-79 years | 2,607 |
| 80+ years | 910 |
| Urbanization (C 2014) | |
|---|---|
| Rural | 110,744 |
| Urban | 19,230 |