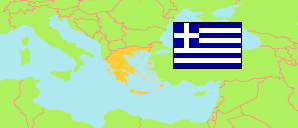
Stereá Elláda
Region in Greece
Contents: Subdivision
The population development in Stereá Elláda as well as related information and services (Wikipedia, Google, images).
| Name | Status | Native | Population Census 1991-03-17 | Population Census 2001-03-18 | Population Census 2011-03-16 | Population Census 2021-10-22 | |
|---|---|---|---|---|---|---|---|
| Stereá Elláda [Central Greece] | Region | Στερεά Ελλάδα | 548,101 | 558,144 | 547,390 | 508,255 | |
| Dímos Agráfon [Agrafa] | Municipality | Δήμος Αγράφων | 8,171 | 7,190 | 6,976 | 5,980 | → |
| Dímos Aliártou [Aliartos] | Municipality | Δήμος Αλιάρτου | 12,193 | 11,686 | 10,887 | 8,772 | → |
| Dímos Amfíkleias - Eláteias [Amfikleia-Elateia] | Municipality | Δήμος Αμφίκλειας - Ελάτειας | 13,144 | 13,024 | 10,922 | 8,374 | → |
| Dímos Chalkidéon [Chalcis] | Municipality | Δήμος Χαλκιδέων | 85,573 | 92,809 | 102,223 | 109,255 | → |
| Dímos Delfón [Delphi] | Municipality | Δήμος Δελφών | 25,710 | 26,992 | 26,716 | 24,164 | → |
| Dímos Dirfýon - Messapíon [Dirfys-Messapia] | Municipality | Δήμος Διρφύων - Μεσσαπίων | 19,843 | 19,443 | 18,800 | 15,936 | → |
| Dímos Distómou - Aráchovas - Antíkyras [Distomo-Arachova-Antikyra] | Municipality | Δήμος Διστόμου - Αράχοβας - Αντίκυρας | 10,475 | 9,802 | 8,188 | 7,613 | → |
| Dímos Domokoú [Domokos] | Municipality | Δήμος Δομοκού | 14,203 | 13,199 | 11,495 | 9,159 | → |
| Dímos Dorídos [Dorida] | Municipality | Δήμος Δωρίδος | 11,056 | 10,874 | 13,627 | 12,035 | → |
| Dímos Erétrias [Eretria] | Municipality | Δήμος Ερέτριας | 10,765 | 12,218 | 13,053 | 12,652 | → |
| Dímos Istiaías - Aidipsoú [Istiaia-Aidipsos] | Municipality | Δήμος Ιστιαίας - Αιδηψού | 22,766 | 22,132 | 21,083 | 19,395 | → |
| Dímos Karpenisíou [Karpenisi] | Municipality | Δήμος Καρπενησίου | 12,219 | 12,328 | 13,105 | 11,445 | → |
| Dímos Karýstou [Karystos] | Municipality | Δήμος Καρύστου | 13,052 | 13,602 | 12,180 | 11,903 | → |
| Dímos Kýmis - Aliveríou [Kymi-Aliveri] | Municipality | Δήμος Κύμης - Αλιβερίου | 31,520 | 30,717 | 28,437 | 26,351 | → |
| Dímos Lamiéon [Lamia] | Municipality | Δήμος Λαμιέων | 70,544 | 74,939 | 75,315 | 66,656 | → |
| Dímos Levadéon [Livadeia] | Municipality | Δήμος Λεβαδέων | 32,263 | 32,151 | 31,315 | 29,379 | → |
| Dímos Lokrón [Lokroi] | Municipality | Δήμος Λοκρών | 22,016 | 22,418 | 19,623 | 17,786 | → |
| Dímos Makrakómis [Makrakomi] | Municipality | Δήμος Μακρακώμης | 16,541 | 17,912 | 16,036 | 13,498 | → |
| Dímos Mantoudíou - Límnis - Agías Ánnas [Mantoudi-Limni-Agia Anna] | Municipality | Δήμος Μαντουδίου - Λίμνης - Αγίας Άννας | 15,681 | 13,673 | 12,045 | 12,237 | → |
| Dímos Mólou - Agíou Konstantínou [Molos-Agios Konstantinos] | Municipality | Δήμος Μώλου - Αγίου Κωνσταντίνου | 13,147 | 13,932 | 12,090 | 10,925 | → |
| Dímos Orchomenoú [Orchomenos] | Municipality | Δήμος Ορχομενού | 14,103 | 13,032 | 11,621 | 9,381 | → |
| Dímos Skýrou [Skyros] | Municipality | Δήμος Σκύρου | 2,931 | 2,711 | 2,994 | 3,053 | → |
| Dímos Stylídas [Stylida] | Municipality | Δήμος Στυλίδας | 13,800 | 14,118 | 12,750 | 11,391 | → |
| Dímos Tanágras [Tanagra] | Municipality | Δήμος Τανάγρας | 20,363 | 21,156 | 19,432 | 18,500 | → |
| Dímos Thivaíon [Thebes] | Municipality | Δήμος Θηβαίων | 36,022 | 36,086 | 36,477 | 32,412 | → |
| Elláda [Greece] | Republic | Ελλάδα | 10,223,392 | 10,934,097 | 10,816,286 | 10,482,487 |
Source: General Secretariat of National Statistical Service of Greece.
Further information about the population structure:
| Gender (C 2021) | |
|---|---|
| Males | 254,511 |
| Females | 253,741 |
| Age Groups (C 2021) | |
|---|---|
| 0-14 years | 66,286 |
| 15-59 years | 311,484 |
| 65+ years | 130,482 |
| Age Distribution (C 2021) | |
|---|---|
| 80+ years | 44,028 |
| 70-79 years | 53,581 |
| 60-69 years | 69,083 |
| 50-59 years | 75,891 |
| 40-49 years | 74,053 |
| 30-39 years | 56,864 |
| 20-29 years | 44,735 |
| 10-19 years | 49,047 |
| 0-9 years | 40,970 |
| Urbanization (C 2021) | |
|---|---|
| Rural | 200,166 |
| Urban | 308,090 |
| Citizenship (C 2021) | |
|---|---|
| Greece | 470,640 |
| EU | 4,590 |
| Europe (rest) | 22,084 |
| Asia | 9,287 |
| Other Citizenship | 1,644 |
| Place of Birth (C 2021) | |
|---|---|
| Same municipality | 344,731 |
| Other municipality in same region | 33,234 |
| Other region | 87,770 |
| Other country | 42,517 |
