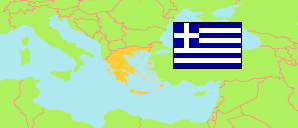
Thessalía
Region in Greece
Contents: Subdivision
The population development in Thessalía as well as related information and services (Wikipedia, Google, images).
| Name | Status | Native | Population Census 1991-03-17 | Population Census 2001-03-18 | Population Census 2011-03-16 | Population Census 2021-10-22 | |
|---|---|---|---|---|---|---|---|
| Thessalía [Thessaly] | Region | Θεσσαλία | 729,268 | 740,115 | 732,762 | 688,255 | |
| Perifereiakí Enótita Kardítsas [Karditsa] | Regional Unit | Περιφερειακή ενότητα Καρδίτσας | 123,202 | 120,265 | 113,544 | 106,302 | → |
| Perifereiakí Enótita Lárisas [Larissa] | Regional Unit | Περιφερειακή ενότητα Λάρισας | 271,786 | 282,156 | 284,325 | 268,962 | → |
| Perifereiakí Enótita Magnisías [Magnesia] | Regional Unit | Περιφερειακή ενότητα Μαγνησίας | 184,690 | 192,086 | 190,010 | 177,447 | → |
| Perifereiakí Enótita Sporádon [Sporades] | Regional Unit | Περιφερειακή ενότητα Σποράδων | 11,562 | 12,919 | 13,798 | 13,457 | → |
| Perifereiakí Enótita Trikálon [Trikala] | Regional Unit | Περιφερειακή ενότητα Τρικάλων | 138,028 | 132,689 | 131,085 | 122,082 | → |
| Elláda [Greece] | Republic | Ελλάδα | 10,223,392 | 10,934,097 | 10,816,286 | 10,482,487 |
Source: General Secretariat of National Statistical Service of Greece.
Further information about the population structure:
| Gender (C 2021) | |
|---|---|
| Males | 338,585 |
| Females | 349,668 |
| Age Groups (C 2021) | |
|---|---|
| 0-14 years | 93,077 |
| 15-59 years | 422,013 |
| 65+ years | 173,169 |
| Age Distribution (C 2021) | |
|---|---|
| 90+ years | 9,081 |
| 80-89 years | 48,837 |
| 70-79 years | 72,119 |
| 60-69 years | 90,595 |
| 50-59 years | 99,482 |
| 40-49 years | 99,723 |
| 30-39 years | 74,566 |
| 20-29 years | 65,045 |
| 10-19 years | 72,293 |
| 0-9 years | 56,521 |
| Urbanization (C 2021) | |
|---|---|
| Rural | 214,467 |
| Urban | 473,764 |
| Citizenship (C 2021) | |
|---|---|
| Greece | 655,318 |
| EU | 4,113 |
| Europe (rest) | 24,724 |
| Asia | 2,688 |
| Other Citizenship | 1,405 |
| Place of Birth (C 2021) | |
|---|---|
| Same municipality | 476,210 |
| Other municipality in same region | 66,872 |
| Other region | 98,351 |
| Other country | 46,819 |
