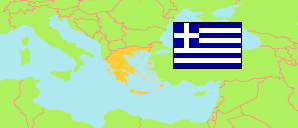
Pelopónnisos
Region in Greece
Contents: Subdivision
The population development in Pelopónnisos as well as related information and services (Wikipedia, Google, images).
| Name | Status | Native | Population Census 1991-03-17 | Population Census 2001-03-18 | Population Census 2011-03-16 | Population Census 2021-10-22 | |
|---|---|---|---|---|---|---|---|
| Pelopónnisos [Peloponnese] | Region | Πελοπόννησος | 573,958 | 597,622 | 577,903 | 539,533 | |
| Perifereiakí Enótita Argolídas [Argolis] | Regional Unit | Περιφερειακή ενότητα Αργολίδας | 94,755 | 102,392 | 97,044 | 93,217 | → |
| Perifereiakí Enótita Arkadías [Arcadia] | Regional Unit | Περιφερειακή ενότητα Αρκαδίας | 95,941 | 91,326 | 86,685 | 77,594 | → |
| Perifereiakí Enótita Korinthías [Corinthia] | Regional Unit | Περιφερειακή ενότητα Κορινθίας | 132,139 | 144,527 | 145,082 | 138,308 | → |
| Perifereiakí Enótita Lakonías [Laconia] | Regional Unit | Περιφερειακή ενότητα Λακωνίας | 90,522 | 92,811 | 89,138 | 84,337 | → |
| Perifereiakí Enótita Messinías [Messenia] | Regional Unit | Περιφερειακή ενότητα Μεσσηνίας | 160,601 | 166,566 | 159,954 | 146,082 | → |
| Elláda [Greece] | Republic | Ελλάδα | 10,223,392 | 10,934,097 | 10,816,286 | 10,482,487 |
Source: General Secretariat of National Statistical Service of Greece.
Further information about the population structure:
| Gender (C 2021) | |
|---|---|
| Males | 270,498 |
| Females | 269,039 |
| Age Groups (C 2021) | |
|---|---|
| 0-14 years | 68,496 |
| 15-59 years | 329,491 |
| 65+ years | 141,551 |
| Age Distribution (C 2021) | |
|---|---|
| 90+ years | 9,858 |
| 80-89 years | 39,146 |
| 70-79 years | 56,446 |
| 60-69 years | 75,325 |
| 50-59 years | 80,784 |
| 40-49 years | 77,380 |
| 30-39 years | 60,035 |
| 20-29 years | 46,893 |
| 10-19 years | 51,704 |
| 0-9 years | 41,970 |
| Urbanization (C 2021) | |
|---|---|
| Rural | 244,119 |
| Urban | 295,433 |
| Citizenship (C 2021) | |
|---|---|
| Greece | 493,455 |
| EU | 10,288 |
| Europe (rest) | 26,684 |
| Asia | 6,804 |
| Other Citizenship | 2,304 |
| Place of Birth (C 2021) | |
|---|---|
| Same municipality | 362,026 |
| Other municipality in same region | 36,762 |
| Other region | 85,280 |
| Other country | 55,474 |
