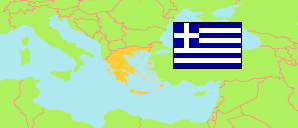
Attikí
Region in Greece
Contents: Subdivision
The population development in Attikí as well as related information and services (Wikipedia, Google, images).
| Name | Status | Native | Population Census 1991-03-17 | Population Census 2001-03-18 | Population Census 2011-03-16 | Population Census 2021-10-22 | |
|---|---|---|---|---|---|---|---|
| Attikí [Attica] | Region | Αττική | 3,594,817 | 3,894,573 | 3,828,434 | 3,814,065 | |
| Perifereiakí Enótita Anatolikís Attikís [East Attica] | Regional Unit | Περιφερειακή ενότητα Ανατολικής Αττικής | 277,207 | 386,067 | 502,348 | 518,753 | → |
| Perifereiakí Enótita Dytikís Attikís [West Attica] | Regional Unit | Περιφερειακή ενότητα Δυτικής Αττικής | 122,365 | 149,794 | 160,927 | 165,540 | → |
| Perifereiakí Enótita Dytikoú Toméa Athinón [West Athens] | Regional Unit | Περιφερειακή ενότητα Δυτικού Τομέα Αθηνών | 471,456 | 499,883 | 489,675 | 478,885 | → |
| Perifereiakí Enótita Kentrikoú Toméa Athinón [Central Athens] | Regional Unit | Περιφερειακή ενότητα Κεντρικού Τομέα Αθηνών | 1,197,601 | 1,179,308 | 1,029,520 | 1,002,210 | → |
| Perifereiakí Enótita Níson [Islands] | Regional Unit | Περιφερειακή ενότητα Νήσων | 62,549 | 71,094 | 74,651 | 70,008 | → |
| Perifereiakí Enótita Notíou Toméa Athinón [South Athens] | Regional Unit | Περιφερειακή ενότητα Νοτίου Τομέα Αθηνών | 490,519 | 542,171 | 529,826 | 529,455 | → |
| Perifereiakí Enótita Peiraiós [Piraeus] | Regional Unit | Περιφερειακή ενότητα Πειραιώς | 467,631 | 482,356 | 448,997 | 448,053 | → |
| Perifereiakí Enótita Voreíou Toméa Athinón [North Athens] | Regional Unit | Περιφερειακή ενότητα Βορείου Τομέα Αθηνών | 505,489 | 583,900 | 592,490 | 601,163 | → |
| Elláda [Greece] | Republic | Ελλάδα | 10,223,392 | 10,934,097 | 10,816,286 | 10,482,487 |
Source: General Secretariat of National Statistical Service of Greece.
Further information about the population structure:
| Gender (C 2021) | |
|---|---|
| Males | 1,837,344 |
| Females | 1,976,723 |
| Age Groups (C 2021) | |
|---|---|
| 0-14 years | 504,217 |
| 15-59 years | 2,500,264 |
| 65+ years | 809,581 |
| Age Distribution (C 2021) | |
|---|---|
| 90+ years | 44,700 |
| 80-89 years | 200,921 |
| 70-79 years | 344,202 |
| 60-69 years | 468,453 |
| 50-59 years | 571,930 |
| 40-49 years | 618,147 |
| 30-39 years | 490,980 |
| 20-29 years | 387,484 |
| 10-19 years | 370,723 |
| 0-9 years | 316,525 |
| Urbanization (C 2021) | |
|---|---|
| Rural | 32,658 |
| Urban | 3,781,407 |
| Citizenship (C 2021) | |
|---|---|
| Greece | 3,469,212 |
| EU | 50,711 |
| Europe (rest) | 171,028 |
| Asia | 90,355 |
| Other Citizenship | 32,757 |
| Place of Birth (C 2021) | |
|---|---|
| Same municipality | 1,619,224 |
| Other municipality in same region | 201,772 |
| Other region | 1,483,816 |
| Other country | 509,249 |
