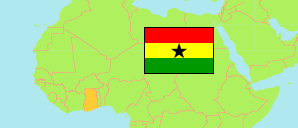
Dormaa East
District in Ghana
Contents: Population
The population development of Dormaa East as well as related information and services (Wikipedia, Google, images).
| Name | Status | Population Census 2010-09-26 | Population Census 2021-06-27 | |
|---|---|---|---|---|
| Dormaa East | District | 50,871 | 67,899 | |
| Ghana | Republic | 24,658,823 | 30,832,019 |
Source: Ghana Statistical Service (web).
Explanation: Area figures of districts are derived from geospatial data.
Further information about the population structure:
| Gender (C 2021) | |
|---|---|
| Males | 33,336 |
| Females | 34,563 |
| Age Groups (C 2021) | |
|---|---|
| 0-14 years | 23,068 |
| 15-64 years | 41,011 |
| 65+ years | 3,820 |
| Age Distribution (C 2021) | |
|---|---|
| 80+ years | 1,096 |
| 70-79 years | 1,388 |
| 60-69 years | 3,247 |
| 50-59 years | 4,888 |
| 40-49 years | 6,529 |
| 30-39 years | 8,952 |
| 20-29 years | 11,438 |
| 10-19 years | 14,976 |
| 0-9 years | 15,385 |
| Urbanization (C 2021) | |
|---|---|
| Rural | 18,896 |
| Urban | 49,003 |
| Literacy (A11+) (C 2021) | |
|---|---|
| yes | 37,370 |
| no | 13,351 |
| Ethnic Group (C 2021) | |
|---|---|
| Akan | 57,633 |
| Ga-Dangme | 359 |
| Ewe | 411 |
| Guan | 68 |
| Gurma | 416 |
| Mole-Dagbani | 6,714 |
| Grusi | 1,627 |
| Mandé | 267 |
| Other Ethnic Group | 231 |