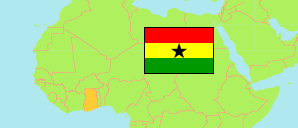
Oti
Region in Ghana
Contents: Subdivision
The population development in Oti as well as related information and services (Wikipedia, Google, images).
| Name | Status | Population Census 2010-09-26 | Population Census 2021-06-27 | |
|---|---|---|---|---|
| Oti (← Volta) | Region | 636,889 | 747,248 | |
| Biakoye | District | 65,901 | 71,827 | → |
| Guan (← Jasikan) | District | ... | 28,238 | → |
| Jasikan | District | ... | 59,695 | → |
| Kadjebi | District | 59,303 | 73,959 | → |
| Krachi East Municipal | Municipal District | 116,804 | 110,435 | → |
| Krachi Nchumuru | District | 72,688 | 79,934 | → |
| Krachi West | District | 49,417 | 61,128 | → |
| Nkwanta North | District | 64,553 | 126,096 | → |
| Nkwanta South Municipal | Municipal District | 117,878 | 135,936 | → |
| Ghana | Republic | 24,658,823 | 30,832,019 |
Source: Ghana Statistical Service (web).
Explanation: Area figures of districts are derived from geospatial data.
Further information about the population structure:
| Gender (C 2021) | |
|---|---|
| Males | 377,392 |
| Females | 369,856 |
| Age Groups (C 2021) | |
|---|---|
| 0-14 years | 299,771 |
| 15-64 years | 415,316 |
| 65+ years | 32,161 |
| Age Distribution (C 2021) | |
|---|---|
| 80+ years | 8,729 |
| 70-79 years | 13,364 |
| 60-69 years | 25,373 |
| 50-59 years | 40,098 |
| 40-49 years | 63,179 |
| 30-39 years | 91,430 |
| 20-29 years | 121,715 |
| 10-19 years | 174,489 |
| 0-9 years | 208,871 |
| Urbanization (C 2021) | |
|---|---|
| Rural | 503,379 |
| Urban | 243,869 |
| Literacy (A11+) (C 2021) | |
|---|---|
| yes | 289,383 |
| no | 226,654 |
| Ethnic Group (C 2021) | |
|---|---|
| Akan | 47,545 |
| Ga-Dangme | 20,649 |
| Ewe | 146,929 |
| Guan | 149,357 |
| Gurma | 332,846 |
| Mole-Dagbani | 7,725 |
| Grusi | 2,513 |
| Mandé | 5,839 |
| Other Ethnic Group | 18,974 |