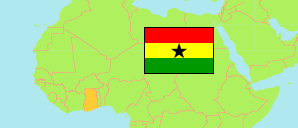
North East
Region in Ghana
Contents: Subdivision
The population development in North East as well as related information and services (Wikipedia, Google, images).
| Name | Status | Population Census 2010-09-26 | Population Census 2021-06-27 | |
|---|---|---|---|---|
| North East (← Northern) | Region | 465,005 | 658,946 | |
| Bunkpurugu-Nyakpanduri | District | 69,786 | 82,384 | → |
| Chereponi | District | 53,394 | 87,176 | → |
| East Mamprusi Municipal | Municipal District | 121,009 | 188,006 | → |
| Mamprugu Moagduri | District | 46,894 | 68,746 | → |
| West Mamprusi Municipal | Municipal District | 121,117 | 175,755 | → |
| Yunyoo-Nasuan | District | 52,805 | 56,879 | → |
| Ghana | Republic | 24,658,823 | 30,832,019 |
Source: Ghana Statistical Service (web).
Explanation: Area figures of districts are derived from geospatial data.
Further information about the population structure:
| Gender (C 2021) | |
|---|---|
| Males | 322,149 |
| Females | 336,797 |
| Age Groups (C 2021) | |
|---|---|
| 0-14 years | 296,448 |
| 15-64 years | 338,678 |
| 65+ years | 23,820 |
| Age Distribution (C 2021) | |
|---|---|
| 80+ years | 7,121 |
| 70-79 years | 11,031 |
| 60-69 years | 15,239 |
| 50-59 years | 23,757 |
| 40-49 years | 44,090 |
| 30-39 years | 73,484 |
| 20-29 years | 114,744 |
| 10-19 years | 154,250 |
| 0-9 years | 215,230 |
| Urbanization (C 2021) | |
|---|---|
| Rural | 444,000 |
| Urban | 214,946 |
| Literacy (A11+) (C 2021) | |
|---|---|
| yes | 167,703 |
| no | 256,746 |
| Ethnic Group (C 2021) | |
|---|---|
| Akan | 61,687 |
| Ga-Dangme | 275 |
| Ewe | 2,414 |
| Guan | 1,455 |
| Gurma | 190,416 |
| Mole-Dagbani | 346,044 |
| Grusi | 16,759 |
| Mandé | 27,223 |
| Other Ethnic Group | 6,145 |