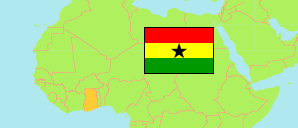
Savannah
Region in Ghana
Contents: Subdivision
The population development in Savannah as well as related information and services (Wikipedia, Google, images).
| Name | Status | Population Census 2010-09-26 | Population Census 2021-06-27 | |
|---|---|---|---|---|
| Savannah (← Northern) | Region | 469,510 | 653,266 | |
| Bole | District | 61,593 | 115,800 | → |
| Central Gonja | District | 87,877 | 142,762 | → |
| East Gonja Municipal | Municipal District | 105,702 | 117,755 | → |
| North East Gonja (← East Gonja Municipal) | District | 29,748 | 39,404 | → |
| North Gonja | District | 43,547 | 61,432 | → |
| Sawla-Tuna-Kalba | District | 99,863 | 112,664 | → |
| West Gonja | District | 41,180 | 63,449 | → |
| Ghana | Republic | 24,658,823 | 30,832,019 |
Source: Ghana Statistical Service (web).
Explanation: Area figures of districts are derived from geospatial data.
Further information about the population structure:
| Gender (C 2021) | |
|---|---|
| Males | 327,687 |
| Females | 325,579 |
| Age Groups (C 2021) | |
|---|---|
| 0-14 years | 276,213 |
| 15-64 years | 355,628 |
| 65+ years | 21,425 |
| Age Distribution (C 2021) | |
|---|---|
| 80+ years | 5,769 |
| 70-79 years | 9,747 |
| 60-69 years | 16,087 |
| 50-59 years | 25,501 |
| 40-49 years | 48,317 |
| 30-39 years | 80,864 |
| 20-29 years | 121,237 |
| 10-19 years | 142,054 |
| 0-9 years | 203,690 |
| Urbanization (C 2021) | |
|---|---|
| Rural | 459,687 |
| Urban | 193,579 |
| Literacy (A11+) (C 2021) | |
|---|---|
| yes | 154,540 |
| no | 277,030 |
| Ethnic Group (C 2021) | |
|---|---|
| Akan | 23,186 |
| Ga-Dangme | 4,090 |
| Ewe | 27,659 |
| Guan | 245,446 |
| Gurma | 27,495 |
| Mole-Dagbani | 205,337 |
| Grusi | 48,993 |
| Mandé | 36,205 |
| Other Ethnic Group | 16,703 |