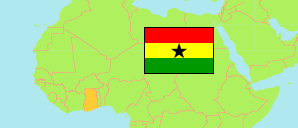
Upper East
Region in Ghana
Contents: Subdivision
The population development in Upper East as well as related information and services (Wikipedia, Google, images).
| Name | Status | Population Census 2010-09-26 | Population Census 2021-06-27 | |
|---|---|---|---|---|
| Upper East | Region | 1,046,545 | 1,301,226 | |
| Bawku Municipal | Municipal District | 98,538 | 119,458 | → |
| Bawku West | District | 94,034 | 144,189 | → |
| Binduri | District | 61,576 | 76,679 | → |
| Bolgatanga East (← Bolgatanga Municipal) | District | 28,254 | 38,824 | → |
| Bolgatanga Municipal | Municipal District | 103,296 | 139,864 | → |
| Bongo | District | 84,545 | 120,254 | → |
| Builsa North Municipal | Municipal District | 56,477 | 56,571 | → |
| Builsa South | District | 36,514 | 36,575 | → |
| Garu | District | 58,362 | 71,774 | → |
| Kassena Nankana Municipal | Municipal District | 109,944 | 99,895 | → |
| Kassena Nankana West | District | 70,667 | 90,735 | → |
| Nabdam | District | 33,826 | 51,861 | → |
| Pusiga | District | 57,677 | 80,533 | → |
| Talensi | District | 81,194 | 87,021 | → |
| Tempane | District | 71,641 | 86,993 | → |
| Ghana | Republic | 24,658,823 | 30,832,019 |
Source: Ghana Statistical Service (web).
Explanation: Area figures of districts are derived from geospatial data.
Further information about the population structure:
| Gender (C 2021) | |
|---|---|
| Males | 631,263 |
| Females | 669,963 |
| Age Groups (C 2021) | |
|---|---|
| 0-14 years | 489,296 |
| 15-64 years | 730,360 |
| 65+ years | 81,570 |
| Age Distribution (C 2021) | |
|---|---|
| 80+ years | 29,725 |
| 70-79 years | 34,009 |
| 60-69 years | 45,054 |
| 50-59 years | 67,992 |
| 40-49 years | 107,133 |
| 30-39 years | 156,763 |
| 20-29 years | 222,195 |
| 10-19 years | 304,105 |
| 0-9 years | 334,250 |
| Urbanization (C 2021) | |
|---|---|
| Rural | 970,968 |
| Urban | 330,258 |
| Literacy (A11+) (C 2021) | |
|---|---|
| yes | 468,094 |
| no | 462,796 |
| Ethnic Group (C 2021) | |
|---|---|
| Akan | 16,257 |
| Ga-Dangme | 1,191 |
| Ewe | 2,873 |
| Guan | 1,343 |
| Gurma | 45,680 |
| Mole-Dagbani | 940,176 |
| Grusi | 191,255 |
| Mandé | 84,840 |
| Other Ethnic Group | 11,177 |