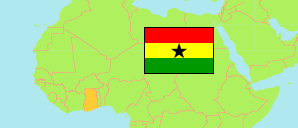
Northern
Region in Ghana
Contents: Subdivision
The population development in Northern as well as related information and services (Wikipedia, Google, images).
| Name | Status | Population Census 2010-09-26 | Population Census 2021-06-27 | |
|---|---|---|---|---|
| Northern | Region | 1,544,946 | 2,310,939 | |
| Gushiegu Municipal | Municipal District | 111,259 | 153,965 | → |
| Karaga | District | 77,706 | 114,225 | → |
| Kpandai | District | 108,816 | 126,213 | → |
| Kumbungu | District | 39,341 | 110,586 | → |
| Mion | District | 81,812 | 94,930 | → |
| Nanton | District | 46,566 | 50,767 | → |
| Nanumba North Municipal | Municipal District | 141,584 | 188,680 | → |
| Nanumba South | District | 93,464 | 106,374 | → |
| Saboba | District | 65,706 | 95,683 | → |
| Sagnarigu Municipal | Municipal District | 148,099 | 341,711 | → |
| Savelugu Municipal | Municipal District | 92,717 | 122,888 | → |
| Tamale Metropolitan (incl. Tamale Central Municipal, Tamale South Municipal) | Metropolitan District | 223,252 | 374,744 | → |
| Tatale-Sangule | District | 60,039 | 74,805 | → |
| Tolon | District | 72,990 | 118,101 | → |
| Yendi Municipal | Municipal District | 117,780 | 154,421 | → |
| Zabzugu | District | 63,815 | 82,846 | → |
| Ghana | Republic | 24,658,823 | 30,832,019 |
Source: Ghana Statistical Service (web).
Explanation: Area figures of districts are derived from geospatial data.
Further information about the population structure:
| Gender (C 2021) | |
|---|---|
| Males | 1,141,705 |
| Females | 1,169,234 |
| Age Groups (C 2021) | |
|---|---|
| 0-14 years | 1,011,689 |
| 15-64 years | 1,225,338 |
| 65+ years | 73,912 |
| Age Distribution (C 2021) | |
|---|---|
| 80+ years | 20,434 |
| 70-79 years | 34,475 |
| 60-69 years | 53,341 |
| 50-59 years | 85,293 |
| 40-49 years | 174,202 |
| 30-39 years | 291,424 |
| 20-29 years | 411,724 |
| 10-19 years | 489,784 |
| 0-9 years | 750,262 |
| Urbanization (C 2021) | |
|---|---|
| Rural | 1,215,131 |
| Urban | 1,095,808 |
| Literacy (A11+) (C 2021) | |
|---|---|
| yes | 604,317 |
| no | 763,495 |
| Ethnic Group (C 2021) | |
|---|---|
| Akan | 39,650 |
| Ga-Dangme | 4,796 |
| Ewe | 23,309 |
| Guan | 38,978 |
| Gurma | 681,418 |
| Mole-Dagbani | 1,431,628 |
| Grusi | 15,096 |
| Mandé | 41,507 |
| Other Ethnic Group | 15,336 |
