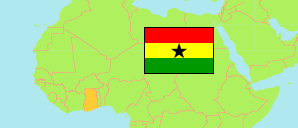
Bono
Region in Ghana
Contents: Subdivision
The population development in Bono as well as related information and services (Wikipedia, Google, images).
| Name | Status | Population Census 2010-09-26 | Population Census 2021-06-27 | |
|---|---|---|---|---|
| Bono (← Brong Ahafo) | Region | 922,617 | 1,208,649 | |
| Banda | District | 20,282 | 28,179 | → |
| Berekum East Municipal | Municipal District | 92,847 | 106,252 | → |
| Berekum West | District | 36,781 | 49,464 | → |
| Dormaa Central Municipal | Municipal District | 112,111 | 112,702 | → |
| Dormaa East | District | 50,871 | 67,899 | → |
| Dormaa West | District | 47,678 | 47,913 | → |
| Jaman North | District | 83,059 | 117,909 | → |
| Jaman South Municipal | Municipal District | 92,649 | 108,388 | → |
| Sunyani Municipal | Municipal District | 123,224 | 193,595 | → |
| Sunyani West | District | 85,272 | 136,022 | → |
| Tain | District | 88,104 | 115,568 | → |
| Wenchi Municipal | Municipal District | 89,739 | 124,758 | → |
| Ghana | Republic | 24,658,823 | 30,832,019 |
Source: Ghana Statistical Service (web).
Explanation: Area figures of districts are derived from geospatial data.
Further information about the population structure:
| Gender (C 2021) | |
|---|---|
| Males | 596,676 |
| Females | 611,973 |
| Age Groups (C 2021) | |
|---|---|
| 0-14 years | 413,642 |
| 15-64 years | 740,593 |
| 65+ years | 54,414 |
| Age Distribution (C 2021) | |
|---|---|
| 80+ years | 15,569 |
| 70-79 years | 20,663 |
| 60-69 years | 45,724 |
| 50-59 years | 71,547 |
| 40-49 years | 110,803 |
| 30-39 years | 170,247 |
| 20-29 years | 227,327 |
| 10-19 years | 262,927 |
| 0-9 years | 283,842 |
| Urbanization (C 2021) | |
|---|---|
| Rural | 500,168 |
| Urban | 708,481 |
| Literacy (A11+) (C 2021) | |
|---|---|
| yes | 667,092 |
| no | 226,786 |
| Ethnic Group (C 2021) | |
|---|---|
| Akan | 880,563 |
| Ga-Dangme | 8,120 |
| Ewe | 17,221 |
| Guan | 4,159 |
| Gurma | 11,976 |
| Mole-Dagbani | 175,152 |
| Grusi | 26,452 |
| Mandé | 62,704 |
| Other Ethnic Group | 14,422 |