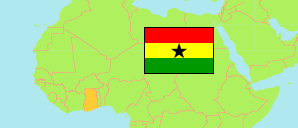
Ashanti
Region in Ghana
Contents: Subdivision
The population development in Ashanti as well as related information and services (Wikipedia, Google, images).
| Name | Status | Population Census 2010-09-26 | Population Census 2021-06-27 | |
|---|---|---|---|---|
| Ashanti | Region | 4,780,380 | 5,440,463 | |
| Adansi Asokwa (← Adansi North) | District | 67,133 | 71,844 | → |
| Adansi North | District | 39,958 | 54,155 | → |
| Adansi South | District | 40,523 | 85,200 | → |
| Afigya Kwabre North | District | 41,593 | 73,330 | → |
| Afigya Kwabre South | District | 94,547 | 234,667 | → |
| Ahafo Ano North Municipal | Municipal District | 94,285 | 92,742 | → |
| Ahafo Ano South East | District | 58,962 | 63,468 | → |
| Ahafo Ano South West | District | 62,697 | 65,770 | → |
| Akrofuom (← Obuasi Municipal) | District | 74,855 | 49,291 | → |
| Amansie Central | District | 90,741 | 93,052 | → |
| Amansie South (← Amansie West) | District | 60,227 | 116,366 | → |
| Amansie West | District | 74,104 | 109,416 | → |
| Asante Akim Central Municipal | Municipal District | 71,508 | 91,673 | → |
| Asante Akim North | District | 69,186 | 85,788 | → |
| Asante Akim South Municipal | Municipal District | 117,245 | 123,633 | → |
| Asokore Mampong Municipal | Municipal District | 304,815 | 191,402 | → |
| Asokwa Municipal (← Kumasi Metropolitan) | Municipal District | 140,161 | 125,642 | → |
| Atwima Kwanwoma | District | 90,634 | 234,846 | → |
| Atwima Mponua | District | 119,180 | 155,254 | → |
| Atwima Nwabiagya Municipal (Atwima Nwabiagya South Municipal) | Municipal District | 85,994 | 161,893 | → |
| Atwima Nwabiagya North (← Atwima Nwabiagya Municipal) | District | 63,031 | 155,025 | → |
| Bekwai Municipal | Municipal District | 118,024 | 137,967 | → |
| Bosome Freho | District | 60,397 | 62,259 | → |
| Bosomtwe | District | 93,910 | 165,180 | → |
| Ejisu Municipal | Municipal District | 95,424 | 180,723 | → |
| Ejura-Sekyedumase Municipal | Municipal District | 85,446 | 137,672 | → |
| Juaben Municipal | Municipal District | 48,338 | 63,929 | → |
| Kumasi Metropolitan (incl. Bantama Municipal, Manhyia North Municipal, Manhyia South Municipal, Nhyiaeso Municipal, Subin Municipal) | Metropolitan District | 728,634 | 443,981 | → |
| Kwabre East | District | 115,556 | 296,814 | → |
| Kwadaso Municipal (← Kumasi Metropolitan) | Municipal District | 251,215 | 154,526 | → |
| Mampong Municipal | Municipal District | 88,051 | 116,632 | → |
| Obuasi East (← Obuasi Municipal) | District | 76,004 | 92,401 | → |
| Obuasi Municipal | Municipal District | 92,637 | 104,297 | → |
| Offinso Municipal | Municipal District | 76,895 | 137,272 | → |
| Offinso North | District | 56,881 | 83,440 | → |
| Oforikrom Municipal (← Kumasi Metropolitan) | Municipal District | 303,016 | 213,126 | → |
| Old Tafo Municipal (← Kumasi Metropolitan) | Municipal District | 146,024 | 114,368 | → |
| Sekyere Afram Plains | District | 28,535 | 32,640 | → |
| Sekyere Central | District | 71,232 | 73,228 | → |
| Sekyere East | District | 62,172 | 74,789 | → |
| Sekyere Kumawu | District | 65,402 | 64,396 | → |
| Sekyere South | District | 94,009 | 120,076 | → |
| Suame Municipal (← Kumasi Metropolitan) | Municipal District | 161,199 | 136,290 | → |
| Ghana | Republic | 24,658,823 | 30,832,019 |
Source: Ghana Statistical Service (web).
Explanation: Area figures of districts are derived from geospatial data.
Further information about the population structure:
| Gender (C 2021) | |
|---|---|
| Males | 2,679,914 |
| Females | 2,760,549 |
| Age Groups (C 2021) | |
|---|---|
| 0-14 years | 1,879,063 |
| 15-64 years | 3,340,806 |
| 65+ years | 220,594 |
| Age Distribution (C 2021) | |
|---|---|
| 80+ years | 53,763 |
| 70-79 years | 89,377 |
| 60-69 years | 196,409 |
| 50-59 years | 317,928 |
| 40-49 years | 506,187 |
| 30-39 years | 772,621 |
| 20-29 years | 1,001,180 |
| 10-19 years | 1,214,799 |
| 0-9 years | 1,288,199 |
| Urbanization (C 2021) | |
|---|---|
| Rural | 2,086,613 |
| Urban | 3,353,850 |
| Literacy (A11+) (C 2021) | |
|---|---|
| yes | 3,347,554 |
| no | 860,533 |
| Ethnic Group (C 2021) | |
|---|---|
| Akan | 3,883,274 |
| Ga-Dangme | 59,358 |
| Ewe | 187,067 |
| Guan | 53,045 |
| Gurma | 204,895 |
| Mole-Dagbani | 670,009 |
| Grusi | 129,073 |
| Mandé | 143,078 |
| Other Ethnic Group | 82,826 |