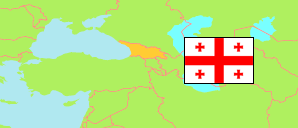
Shida Kartli
Region in Administrative Division
Contents: Subdivision
The population development in Shida Kartli as well as related information and services (Wikipedia, Google, images).
| Name | Status | Native | Population Census 1989-01-12 | Population Census 2002-01-17 | Population Census 2014-11-05 | Population Census 2024-11-14 | |
|---|---|---|---|---|---|---|---|
| Shida Kartli | Region | შიდა ქართლი | 321,598 | 314,039 | 263,382 | 250,600 | |
| Gori | Municipality | გორის მუნიციპალიტეტი | 149,472 | 148,686 | 125,692 | 121,500 | → |
| Kareli | Municipality | ქარელის მუნიციპალიტეტი | 50,730 | 50,422 | 41,316 | 37,900 | → |
| Kaspi | Municipality | კასპის მუნიციპალიტეტი | 55,629 | 52,217 | 43,771 | 40,900 | → |
| Khashuri | Municipality | ხაშურის მუნიციპალიტეტი | 65,767 | 62,714 | 52,603 | 50,200 | → |
| Sakartwelo [Georgia] | Areas under control of the central government | საქართველო | 4,921,955 | 4,361,876 | 3,713,804 | 3,914,000 |
Source: National Statistics Office of Georgia, pop-stat.mashke.org.
Explanation: The results of the 2024 census are preliminary. Area figures are computed by using geospatial data.
Further information about the population structure:
| Gender (C 2024) | |
|---|---|
| Males | 121,500 |
| Females | 129,200 |
| Age Groups (C 2014) | |
|---|---|
| 0-14 years | 48,550 |
| 15-64 years | 175,591 |
| 65+ years | 39,241 |
| Age Distribution (C 2014) | |
|---|---|
| 0-9 years | 33,220 |
| 10-19 years | 31,014 |
| 20-29 years | 35,897 |
| 30-39 years | 35,012 |
| 40-49 years | 35,480 |
| 50-59 years | 38,323 |
| 60-69 years | 26,270 |
| 70-79 years | 19,725 |
| 80+ years | 8,441 |
| Urbanization (C 2024) | |
|---|---|
| Rural | 143,900 |
| Urban | 106,700 |
| Internally Displaced Persons (C 2014) | |
|---|---|
| no IDP | 250,000 |
| IDP | 13,000 |
| Ethnic Group (C 2014) | |
|---|---|
| Georgians | 249,479 |
| Armenians | 2,072 |
| Azeris | 5,501 |
| Other group | 6,317 |
| Religion (C 2014) | |
|---|---|
| Orthodox | 252,494 |
| Armenian Apostolic Church | 97 |
| Muslims | 5,650 |
| Other religion | 2,911 |
| No religion | 615 |