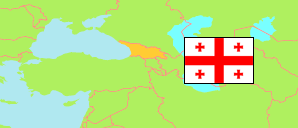
Samegrelo-Zemo Svaneti
Region in Administrative Division
Contents: Subdivision
The population development in Samegrelo-Zemo Svaneti as well as related information and services (Wikipedia, Google, images).
| Name | Status | Native | Population Census 1989-01-12 | Population Census 2002-01-17 | Population Census 2014-11-05 | Population Census 2024-11-14 | |
|---|---|---|---|---|---|---|---|
| Samegrelo-Zemo Svaneti | Region | სამეგრელო-ზემო სვანეთი | 424,746 | 466,100 | 330,761 | 309,100 | |
| Abasha | Municipality | აბაშის მუნიციპალიტეტი | 28,341 | 28,707 | 22,341 | 19,200 | → |
| Chkhorotsqu | Municipality | ჩხოროწყუს მუნიციპალიტეტი | 30,196 | 30,124 | 22,309 | 20,300 | → |
| Khobi | Municipality | ხობის მუნიციპალიტეტი | 38,782 | 41,240 | 30,548 | 26,300 | → |
| Martvili | Municipality | მარტვილის მუნიციპალიტეტი | 46,106 | 44,627 | 33,463 | 28,900 | → |
| Mestia | Municipality | მესტიის მუნიციპალიტეტი | 14,709 | 14,248 | 9,316 | 9,800 | → |
| Poti | City | ფოთი | 50,569 | 47,149 | 41,465 | 38,800 | → |
| Senaki | Municipality | სენაკის მუნიციპალიტეტი | 52,442 | 52,112 | 39,652 | 35,200 | → |
| Tsalenjikha | Municipality | წალენჯიხის მუნიციპალიტეტი | 38,755 | 40,133 | 26,158 | 21,900 | → |
| Zugdidi | Municipality | ზუგდიდის მუნიციპალიტეტი | 124,846 | 167,760 | 105,509 | 108,600 | → |
| Sakartwelo [Georgia] | Areas under control of the central government | საქართველო | 4,921,955 | 4,361,876 | 3,713,804 | 3,914,000 |
Source: National Statistics Office of Georgia, pop-stat.mashke.org.
Explanation: The results of the 2024 census are preliminary. Area figures are computed by using geospatial data.
Further information about the population structure:
| Gender (C 2024) | |
|---|---|
| Males | 146,100 |
| Females | 163,000 |
| Age Groups (C 2014) | |
|---|---|
| 0-14 years | 55,815 |
| 15-64 years | 218,620 |
| 65+ years | 56,326 |
| Age Distribution (C 2014) | |
|---|---|
| 0-9 years | 38,516 |
| 10-19 years | 35,039 |
| 20-29 years | 39,198 |
| 30-39 years | 43,848 |
| 40-49 years | 44,571 |
| 50-59 years | 50,257 |
| 60-69 years | 39,352 |
| 70-79 years | 27,672 |
| 80+ years | 12,308 |
| Urbanization (C 2024) | |
|---|---|
| Rural | 168,800 |
| Urban | 140,300 |
| Internally Displaced Persons (C 2014) | |
|---|---|
| no IDP | 283,000 |
| IDP | 47,000 |
| Ethnic Group (C 2014) | |
|---|---|
| Georgians | 328,662 |
| Armenians | 143 |
| Azeris | 64 |
| Other group | 1,887 |
| Religion (C 2014) | |
|---|---|
| Orthodox | 326,061 |
| Armenian Apostolic Church | 23 |
| Muslims | 766 |
| Other religion | 1,545 |
| No religion | 338 |