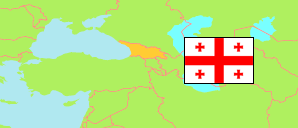
Kakheti
Region in Administrative Division
Contents: Subdivision
The population development in Kakheti as well as related information and services (Wikipedia, Google, images).
| Name | Status | Native | Population Census 1989-01-12 | Population Census 2002-01-17 | Population Census 2014-11-05 | Population Census 2024-11-14 | |
|---|---|---|---|---|---|---|---|
| Kakheti | Region | კახეთი | 441,045 | 407,182 | 318,583 | 301,400 | |
| Akhmeta | Municipality | ახმეტის მუნიციპალიტეტი | 42,167 | 41,641 | 31,461 | 28,800 | → |
| Dedoplistsqaro | Municipality | დედოფლისწყაროს მუნიციპალიტეტი | 36,329 | 30,811 | 21,221 | 18,800 | → |
| Gurjaani | Municipality | გურჯაანის მუნიციპალიტეტი | 78,648 | 72,618 | 54,337 | 50,600 | → |
| Kvareli | Municipality | ყვარლის მუნიციპალიტეტი | 42,620 | 37,658 | 29,827 | 28,500 | → |
| Lagodekhi | Municipality | ლაგოდეხის მუნიციპალიტეტი | 54,171 | 51,066 | 41,678 | 39,200 | → |
| Sagarejo | Municipality | საგარეჯოს მუნიციპალიტეტი | 60,159 | 59,212 | 51,761 | 50,300 | → |
| Sighnaghi | Municipality | სიღნაღის მუნიციპალიტეტი | 49,151 | 43,587 | 29,948 | 28,500 | → |
| Telavi | Municipality | თელავის მუნიციპალიტეტი | 77,800 | 70,589 | 58,350 | 56,700 | → |
| Sakartwelo [Georgia] | Areas under control of the central government | საქართველო | 4,921,955 | 4,361,876 | 3,713,804 | 3,914,000 |
Source: National Statistics Office of Georgia, pop-stat.mashke.org.
Explanation: The results of the 2024 census are preliminary. Area figures are computed by using geospatial data.
Further information about the population structure:
| Gender (C 2024) | |
|---|---|
| Males | 146,200 |
| Females | 155,200 |
| Age Groups (C 2014) | |
|---|---|
| 0-14 years | 56,704 |
| 15-64 years | 206,396 |
| 65+ years | 55,483 |
| Age Distribution (C 2014) | |
|---|---|
| 0-9 years | 39,289 |
| 10-19 years | 35,631 |
| 20-29 years | 40,827 |
| 30-39 years | 39,447 |
| 40-49 years | 40,259 |
| 50-59 years | 47,411 |
| 60-69 years | 36,446 |
| 70-79 years | 26,391 |
| 80+ years | 12,882 |
| Urbanization (C 2024) | |
|---|---|
| Rural | 239,400 |
| Urban | 62,000 |
| Internally Displaced Persons (C 2014) | |
|---|---|
| no IDP | 317,000 |
| IDP | 2,000 |
| Ethnic Group (C 2014) | |
|---|---|
| Georgians | 271,298 |
| Armenians | 2,191 |
| Azeris | 32,354 |
| Other group | 12,704 |
| Religion (C 2014) | |
|---|---|
| Orthodox | 273,177 |
| Armenian Apostolic Church | 182 |
| Muslims | 38,683 |
| Other religion | 1,943 |
| No religion | 931 |